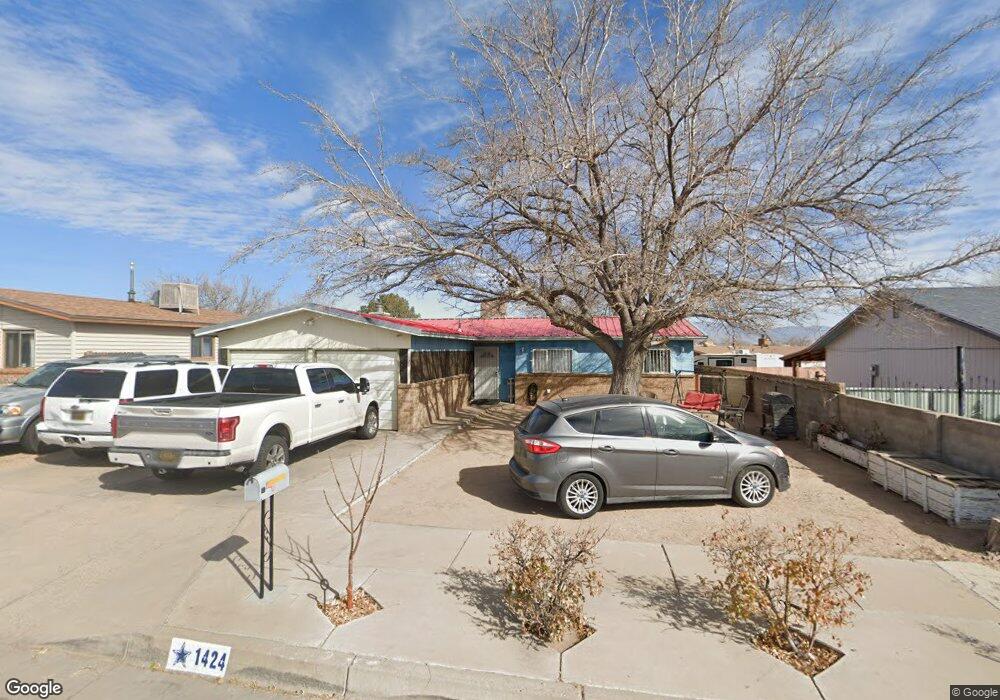
1424 Locura Rd SW Albuquerque, NM 87121
Southwest Heights NeighborhoodEstimated Value: $231,000 - $262,000
3
Beds
2
Baths
1,242
Sq Ft
$203/Sq Ft
Est. Value
About This Home
This home is located at 1424 Locura Rd SW, Albuquerque, NM 87121 and is currently estimated at $252,537, approximately $203 per square foot. 1424 Locura Rd SW is a home located in Bernalillo County with nearby schools including Maryann Binford Elementary School, Truman Middle School, and Atrisco Heritage Academy High School.
Ownership History
Date
Name
Owned For
Owner Type
Purchase Details
Closed on
Jul 27, 2017
Sold by
Chavez Kenya
Bought by
Lugo Silvia
Current Estimated Value
Home Financials for this Owner
Home Financials are based on the most recent Mortgage that was taken out on this home.
Original Mortgage
$80,000
Outstanding Balance
$66,503
Interest Rate
3.91%
Mortgage Type
New Conventional
Estimated Equity
$186,034
Purchase Details
Closed on
Feb 13, 2003
Sold by
Santa Fe Charter Llc
Bought by
Chavez Kenya
Home Financials for this Owner
Home Financials are based on the most recent Mortgage that was taken out on this home.
Original Mortgage
$84,778
Interest Rate
5.9%
Purchase Details
Closed on
Jan 23, 2002
Sold by
Cagle Clarke
Bought by
Santa Fe Charter Llc
Purchase Details
Closed on
Jun 26, 2001
Sold by
Demarcus James O
Bought by
The Bank Of New York
Create a Home Valuation Report for This Property
The Home Valuation Report is an in-depth analysis detailing your home's value as well as a comparison with similar homes in the area
Home Values in the Area
Average Home Value in this Area
Purchase History
| Date | Buyer | Sale Price | Title Company |
|---|---|---|---|
| Lugo Silvia | -- | Stewart Title | |
| Chavez Kenya | -- | Albuquerque Title Company | |
| Santa Fe Charter Llc | -- | -- | |
| The Bank Of New York | -- | -- |
Source: Public Records
Mortgage History
| Date | Status | Borrower | Loan Amount |
|---|---|---|---|
| Open | Lugo Silvia | $80,000 | |
| Previous Owner | Chavez Kenya | $84,778 |
Source: Public Records
Tax History Compared to Growth
Tax History
| Year | Tax Paid | Tax Assessment Tax Assessment Total Assessment is a certain percentage of the fair market value that is determined by local assessors to be the total taxable value of land and additions on the property. | Land | Improvement |
|---|---|---|---|---|
| 2025 | $1,611 | $39,333 | $8,152 | $31,181 |
| 2024 | $1,611 | $38,188 | $7,915 | $30,273 |
| 2023 | $1,584 | $37,075 | $7,684 | $29,391 |
| 2022 | $1,531 | $35,996 | $7,461 | $28,535 |
| 2021 | $1,480 | $34,948 | $7,244 | $27,704 |
| 2020 | $1,455 | $33,930 | $7,033 | $26,897 |
| 2019 | $1,469 | $34,264 | $7,033 | $27,231 |
| 2018 | $1,428 | $34,264 | $7,033 | $27,231 |
| 2017 | $1,209 | $33,530 | $7,033 | $26,497 |
| 2016 | $1,174 | $27,602 | $7,244 | $20,358 |
| 2015 | $26,798 | $26,798 | $7,033 | $19,765 |
| 2014 | $1,148 | $27,031 | $7,033 | $19,998 |
| 2013 | -- | $27,031 | $7,033 | $19,998 |
Source: Public Records
Map
Nearby Homes
- 1209 Locura Rd SW
- 8600 Kimela Ct SW
- 9300 Jenny Ave SW
- 8709 Rhonda Ave SW
- 9508 Sage Ranch Ct SW
- 9504 Sage Ranch Ct
- 1420 Summerfield Place SW
- 9520 Sage Ranch Ct SW
- 9600 Sage Ranch Ct
- 9616 Sage Ranch Ct SW
- 9609 Sage Ranch Ct SW
- 9620 Sage Ranch Ct
- 1815 Shadetree Dr SW
- 1327 Amole Vista St SW
- 7901 Purple Fringe Rd SW
- 921 Roma Dora Ln
- 7814 Desert Canyon Place SW
- 0 Sage & 90th St SW Unit 1083191
- 0 Nwq Unser and Sage SW Unit 1081546
- 1615 Quiet Desert Dr SW
- 1428 Locura Rd SW
- 1420 Locura Rd SW
- 8800 Robby Ave SW
- 1432 Locura Rd SW
- 1416 Locura Rd SW
- 8804 Robby Ave SW
- 8722 Robby Ave SW
- 1425 Locura Rd SW
- 1421 Locura Rd SW
- 8808 Robby Ave SW
- 1429 Locura Rd SW
- 1436 Locura Rd SW
- 1412 Locura Rd SW
- 1417 Locura Rd SW
- 8718 Robby Ave SW
- 8812 Robby Ave SW
- 1437 Locura Rd SW
- 8516 Brian Ave SW
- 1413 Locura Rd SW