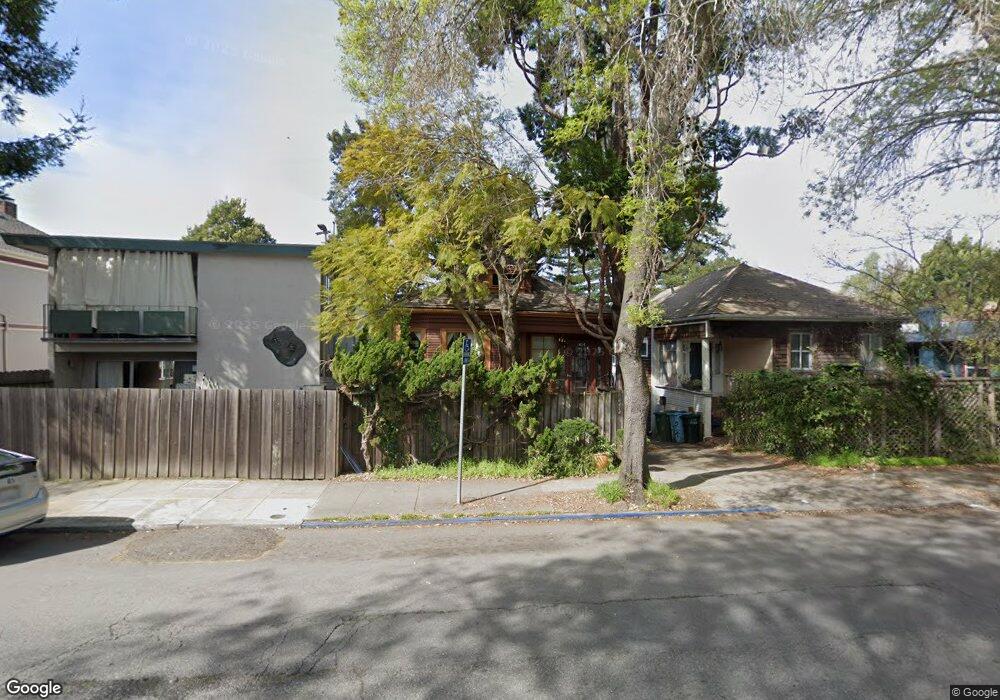
1424 Martin Luther King jr Way Berkeley, CA 94709
North Berkeley NeighborhoodEstimated Value: $1,115,000 - $1,864,000
About This Home
This home is located at 1424 Martin Luther King jr Way, Berkeley, CA 94709 and is currently estimated at $1,527,000, approximately $655 per square foot. 1424 Martin Luther King jr Way is a home located in Alameda County with nearby schools including Berkeley Arts Magnet at Whittier School, Ruth Acty Elementary, and Thousand Oaks Elementary School.
Ownership History
Purchase Details
Purchase Details
Home Financials for this Owner
Home Financials are based on the most recent Mortgage that was taken out on this home.Home Values in the Area
Average Home Value in this Area
Purchase History
We collect this data history from publicly available records. To have your information removed, we recommend requesting removal directly through your county’s website.
| Date | Buyer | Sale Price | Title Company |
|---|---|---|---|
| Fredric & Sandra Gey Revocable Living Tr | -- | None Available | |
| Gey Fredric | -- | Chicago Title Company |
Mortgage History
We collect this data history from publicly available records. To have your information removed, we recommend requesting removal directly through your county’s website.
| Date | Status | Borrower | Loan Amount |
|---|---|---|---|
| Open | Gey Fredric | $186,500 |
Tax History
| Year | Tax Paid | Tax Assessment Tax Assessment Total Assessment is a certain percentage of the fair market value that is determined by local assessors to be the total taxable value of land and additions on the property. | Land | Improvement |
|---|---|---|---|---|
| 2025 | $6,166 | $76,115 | $61,049 | $22,066 |
| 2024 | $6,166 | $74,485 | $59,852 | $21,633 |
| 2023 | $5,985 | $79,888 | $58,679 | $21,209 |
| 2022 | $5,756 | $71,321 | $57,528 | $20,793 |
| 2021 | $5,688 | $69,785 | $56,400 | $20,385 |
| 2020 | $5,080 | $75,998 | $55,822 | $20,176 |
| 2019 | $4,550 | $74,509 | $54,728 | $19,781 |
| 2018 | $4,402 | $73,048 | $53,655 | $19,393 |
| 2017 | $4,207 | $71,616 | $52,603 | $19,013 |
| 2016 | $3,852 | $70,211 | $51,571 | $18,640 |
| 2015 | $3,768 | $69,157 | $50,797 | $18,360 |
| 2014 | $3,834 | $67,802 | $49,802 | $18,000 |
Map
- 1425 Martin Luther King jr Way
- 1841 Vine St
- 1408 Henry St
- 1511 Grant St
- 1545 Josephine St
- 1429 Edith St
- 1609 Bonita Ave Unit 5
- 1444 Walnut St
- 1626 Hopkins St
- 1733 Milvia St
- 1643 Walnut St
- 1682 Oxford St
- 1906 Delaware St
- 2201 Virginia St Unit 2
- 1490 Arch St
- 2015 Hearst Ave
- 1734 Spruce St
- 1616 Francisco St
- 1739 Spruce St
- 1720 Hearst Ave
- 1429 Martin Luther King jr Way
- 1423 Martin Luther King jr Way Unit A3
- 1423 Martin Luther King jr Way Unit A1
- 1423 Martin Luther King jr Way Unit B1
- 1423 Martin Luther King jr Way Unit A4
- 1423 Martin Luther King jr Way Unit A2
- 1433 Martin Luther King jr Way
- 1421 Martin Luther King jr Way
- 1435 Martin Luther King jr Way
- 1420 Bonita Ave
- 1422 Bonita Ave
- 1419 Martin Luther King jr Way
- 1437 Martin Luther King jr Way
- 1418 Bonita Ave
- 1428 Bonita Ave
- 1414 Bonita Ave
- 1428 Martin Luther King jr Way
- 1441 Mlk jr Way Unit 1445
- 1426 Martin Luther King jr Way
- 1422 Martin Luther King jr Way
Ask me questions while you tour the home.