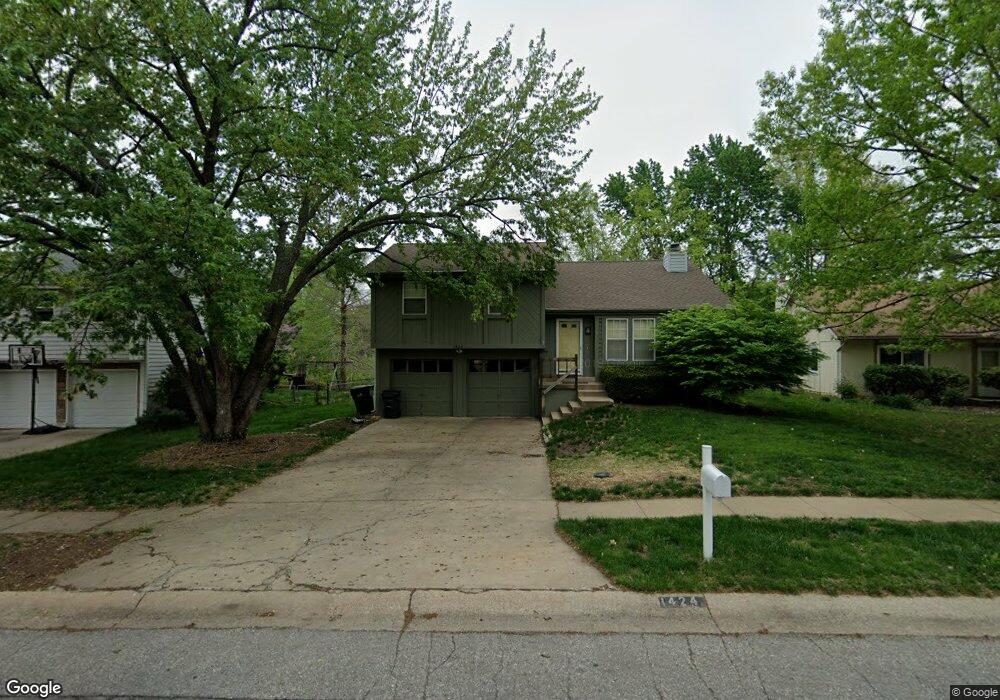
1424 N Martway Dr Unit D Olathe, KS 66061
Estimated Value: $317,000 - $335,000
3
Beds
3
Baths
1,307
Sq Ft
$248/Sq Ft
Est. Value
About This Home
This home is located at 1424 N Martway Dr Unit D, Olathe, KS 66061 and is currently estimated at $324,596, approximately $248 per square foot. 1424 N Martway Dr Unit D is a home located in Johnson County with nearby schools including Washington Elementary School, Santa Fe Trail Middle School, and Olathe North Sr High School.
Ownership History
Date
Name
Owned For
Owner Type
Purchase Details
Closed on
Apr 4, 2025
Sold by
Monceret Tiffany and Mcvaugh Tiffany
Bought by
Madden Olivia and Muro Luis
Current Estimated Value
Home Financials for this Owner
Home Financials are based on the most recent Mortgage that was taken out on this home.
Original Mortgage
$308,750
Outstanding Balance
$307,408
Interest Rate
6.76%
Mortgage Type
New Conventional
Estimated Equity
$17,188
Purchase Details
Closed on
Apr 21, 2016
Sold by
Nelson Sondra M
Bought by
Mcvaugh Tiffany
Purchase Details
Closed on
Oct 21, 2002
Sold by
Cooper Katherine J
Bought by
Cooper Katherine J and Katherine J Cooper Revocable Trust
Purchase Details
Closed on
Jun 26, 2002
Sold by
Cooper Katherine J
Bought by
Nelson Stephen B and Nelson Sondra M
Home Financials for this Owner
Home Financials are based on the most recent Mortgage that was taken out on this home.
Original Mortgage
$87,594
Interest Rate
5.51%
Mortgage Type
Seller Take Back
Create a Home Valuation Report for This Property
The Home Valuation Report is an in-depth analysis detailing your home's value as well as a comparison with similar homes in the area
Home Values in the Area
Average Home Value in this Area
Purchase History
| Date | Buyer | Sale Price | Title Company |
|---|---|---|---|
| Madden Olivia | -- | Security 1St Title | |
| Mcvaugh Tiffany | -- | Platinum Title Llc | |
| Cooper Katherine J | -- | -- | |
| Nelson Stephen B | -- | -- |
Source: Public Records
Mortgage History
| Date | Status | Borrower | Loan Amount |
|---|---|---|---|
| Open | Madden Olivia | $308,750 | |
| Previous Owner | Nelson Stephen B | $87,594 |
Source: Public Records
Tax History Compared to Growth
Tax History
| Year | Tax Paid | Tax Assessment Tax Assessment Total Assessment is a certain percentage of the fair market value that is determined by local assessors to be the total taxable value of land and additions on the property. | Land | Improvement |
|---|---|---|---|---|
| 2024 | $3,202 | $28,980 | $6,713 | $22,267 |
| 2023 | $3,246 | $28,566 | $6,103 | $22,463 |
| 2022 | $3,021 | $25,875 | $5,086 | $20,789 |
| 2021 | $3,031 | $24,610 | $5,086 | $19,524 |
| 2020 | $2,933 | $23,610 | $4,416 | $19,194 |
| 2019 | $2,823 | $22,586 | $4,415 | $18,171 |
| 2018 | $2,703 | $21,482 | $3,841 | $17,641 |
| 2017 | $2,564 | $20,182 | $3,481 | $16,701 |
| 2016 | $2,065 | $16,732 | $3,481 | $13,251 |
| 2015 | $2,010 | $16,307 | $3,171 | $13,136 |
| 2013 | -- | $14,582 | $2,946 | $11,636 |
Source: Public Records
Map
Nearby Homes
- 1305 E 123rd Terrace Unit B
- 1416 E 125th Terrace Unit B
- 1021 E Pineview St
- 1267 N Petzold Units A B C D Dr
- 976 E 120th St
- 968 E 120th St
- 960 E 120th St
- 952 E 120th St
- 944 E 120th St
- 936 E 120th St
- 928 E 120th St
- 920 E 120th St
- 912 E 120th St
- 904 E 120th St
- 1350 N Prince Edward Island St
- No Address W 119th St
- 1268 N Lucy Montgomery Way
- 1700 N Sunset St
- 1121 N Julia St
- 1051 E 121st St
- 1424 N Martway Dr
- 1428 N Martway Dr
- 1420 N Martway Dr
- 1410 N Martway Dr
- 1432 N Martway Dr
- 1423 N Mart-Way Dr Unit C
- 1419 N Martway Dr
- 1423 N Martway Dr
- 1415 N Martway Dr
- 1427 N Martway Dr
- 1436 N Martway Dr
- 1406 N Mart-Way Dr
- 1406 N Martway Dr
- 1407 N Martway Dr
- 1431 N Martway Dr
- 1407 N Mart-Way Dr
- 1440 N Martway Dr
- 1428 E 123rd St
- 1435 N Martway Dr
- 1418 E 123rd St