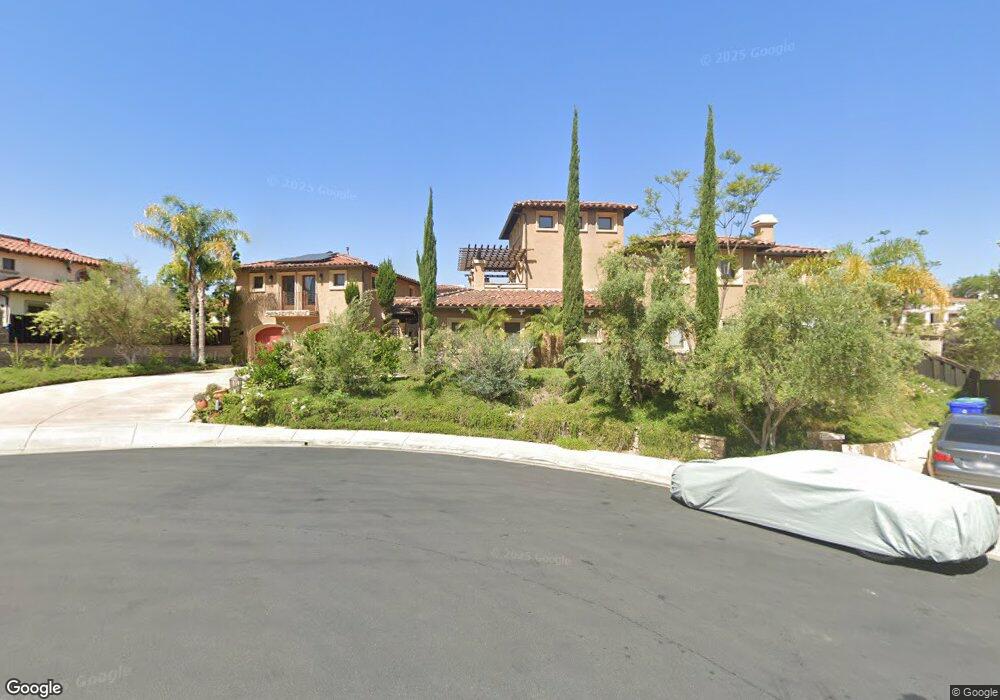
14246 Via Michelangelo San Diego, CA 92129
Rancho Peñasquitos NeighborhoodEstimated Value: $2,462,000 - $2,956,000
5
Beds
6
Baths
5,023
Sq Ft
$545/Sq Ft
Est. Value
About This Home
This home is located at 14246 Via Michelangelo, San Diego, CA 92129 and is currently estimated at $2,738,521, approximately $545 per square foot. 14246 Via Michelangelo is a home located in San Diego County with nearby schools including Adobe Bluffs Elementary School, Black Mountain Middle School, and Mt. Carmel High School.
Ownership History
Date
Name
Owned For
Owner Type
Purchase Details
Closed on
Jun 12, 2006
Sold by
Williams Julie A and Williams Michael W
Bought by
Kuo Jane and Akusu Suguru
Current Estimated Value
Home Financials for this Owner
Home Financials are based on the most recent Mortgage that was taken out on this home.
Original Mortgage
$600,000
Outstanding Balance
$353,934
Interest Rate
6.63%
Mortgage Type
Purchase Money Mortgage
Estimated Equity
$2,384,587
Purchase Details
Closed on
Jun 28, 2004
Sold by
Torrey Brooke Development Inc
Bought by
Williams Julie A and Williams Michael W
Home Financials for this Owner
Home Financials are based on the most recent Mortgage that was taken out on this home.
Original Mortgage
$1,131,464
Interest Rate
4.87%
Mortgage Type
Purchase Money Mortgage
Create a Home Valuation Report for This Property
The Home Valuation Report is an in-depth analysis detailing your home's value as well as a comparison with similar homes in the area
Home Values in the Area
Average Home Value in this Area
Purchase History
| Date | Buyer | Sale Price | Title Company |
|---|---|---|---|
| Kuo Jane | $1,450,000 | Commonwealth Land Title Co | |
| Williams Julie A | $1,414,000 | Fidelity National Title |
Source: Public Records
Mortgage History
| Date | Status | Borrower | Loan Amount |
|---|---|---|---|
| Open | Kuo Jane | $600,000 | |
| Previous Owner | Williams Julie A | $1,131,464 |
Source: Public Records
Tax History Compared to Growth
Tax History
| Year | Tax Paid | Tax Assessment Tax Assessment Total Assessment is a certain percentage of the fair market value that is determined by local assessors to be the total taxable value of land and additions on the property. | Land | Improvement |
|---|---|---|---|---|
| 2025 | $22,449 | $1,942,653 | $576,094 | $1,366,559 |
| 2024 | $22,449 | $1,904,563 | $564,799 | $1,339,764 |
| 2023 | $21,951 | $1,867,220 | $553,725 | $1,313,495 |
| 2022 | $21,541 | $1,830,609 | $542,868 | $1,287,741 |
| 2021 | $21,124 | $1,794,716 | $532,224 | $1,262,492 |
| 2020 | $20,911 | $1,776,314 | $526,767 | $1,249,547 |
| 2019 | $20,511 | $1,741,486 | $516,439 | $1,225,047 |
| 2018 | $20,094 | $1,707,340 | $506,313 | $1,201,027 |
| 2017 | $19,692 | $1,673,864 | $496,386 | $1,177,478 |
| 2016 | $19,255 | $1,641,044 | $486,653 | $1,154,391 |
| 2015 | $18,956 | $1,616,395 | $479,344 | $1,137,051 |
| 2014 | -- | $1,584,733 | $469,955 | $1,114,778 |
Source: Public Records
Map
Nearby Homes
- 8862 La Cartera St
- 14305 El Vestido St
- 9120 Meadowrun Place
- 13907 Bruyere Ct
- 8183 Doug Hill
- 9151 Emden Rd
- 14442 Calle Nublado
- 8730 Twin Trails Dr
- 9360 Stargaze Ave
- 8114 Sendero de La Pradera
- 7808 Santaluz Inlet
- 7855 Via Belfiore Unit 1
- 8415 Run of the Knolls
- 13146 Thunderhead St
- 7975 Villas
- 13445 Appalachian Way
- 13338 Via Magdalena Unit 1
- 14522 Las Haciendas
- 12740 Prairie Dog Ave
- 12880 War Horse St
- 14238 Via Michelangelo
- 14242 Via Michelangelo
- 14234 Via Michelangelo
- 14214 Via Michelangelo
- 14218 Via Michelangelo
- 14210 Via Michelangelo
- 14230 Via Michelangelo
- 14248 Via Michelangelo Unit 14250
- 14248 Via Michelangelo
- 14260 La Harina Court N Unit 1
- 14272 La Trucha St
- 14260 La Trucha St
- 14284 La Trucha St
- 14248 La Trucha St
- 0000 La Harina Ct
- 14296 La Trucha St
- 14236 La Trucha St
- 14215 Via Michelangelo
- 14207 Via Michelangelo
- 14250 La Harina Ct