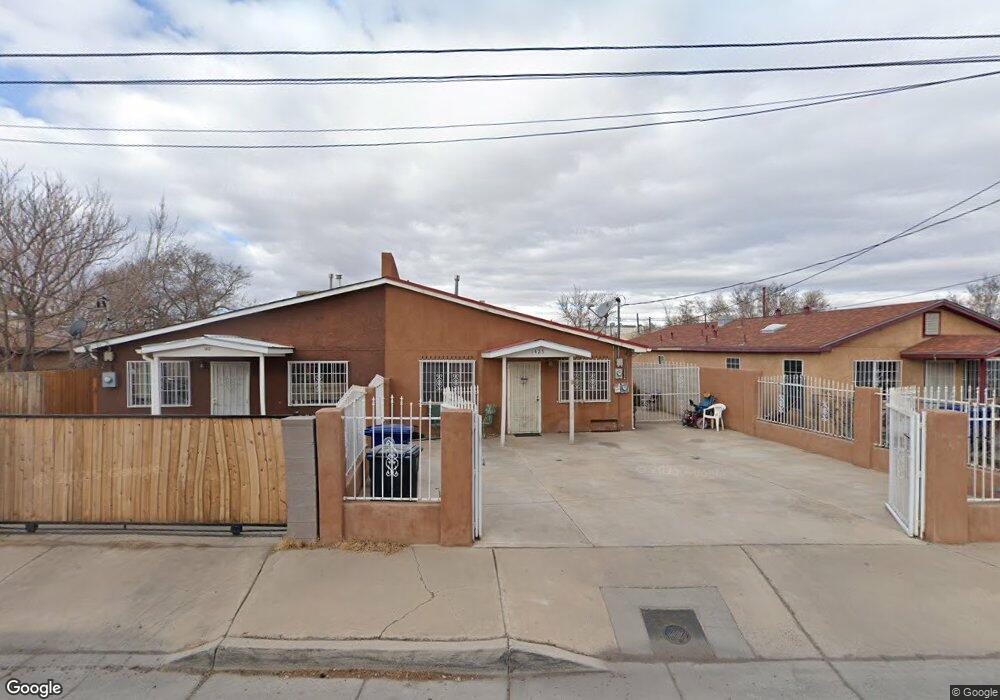
1425 3rd St SW Albuquerque, NM 87102
Barelas NeighborhoodEstimated Value: $220,000 - $327,000
3
Beds
2
Baths
1,152
Sq Ft
$220/Sq Ft
Est. Value
About This Home
This home is located at 1425 3rd St SW, Albuquerque, NM 87102 and is currently estimated at $253,817, approximately $220 per square foot. 1425 3rd St SW is a home located in Bernalillo County with nearby schools including Washington Middle School, Albuquerque High School, and William W & Josephine Dorn Charter Community School.
Ownership History
Date
Name
Owned For
Owner Type
Purchase Details
Closed on
Sep 29, 2005
Sold by
Gonzales Michael A
Bought by
Glover John and Glover Dolores
Current Estimated Value
Home Financials for this Owner
Home Financials are based on the most recent Mortgage that was taken out on this home.
Original Mortgage
$69,299
Interest Rate
5.73%
Mortgage Type
Fannie Mae Freddie Mac
Purchase Details
Closed on
Dec 27, 2000
Sold by
Old Standard Life Insurance Co
Bought by
Glover John and Glover Dolores
Purchase Details
Closed on
Dec 5, 2000
Sold by
Gonzales Michael A
Bought by
Old Standard Life Insurance Company
Purchase Details
Closed on
Jan 12, 1996
Sold by
Glover John and Glover Dolores
Bought by
Gonzales Michael A
Purchase Details
Closed on
Mar 12, 1995
Sold by
Foster Robert C
Bought by
Gonzales Michael A
Create a Home Valuation Report for This Property
The Home Valuation Report is an in-depth analysis detailing your home's value as well as a comparison with similar homes in the area
Home Values in the Area
Average Home Value in this Area
Purchase History
| Date | Buyer | Sale Price | Title Company |
|---|---|---|---|
| Glover John | -- | Richmond Title Services | |
| Glover John | -- | Richmond Title Svcs | |
| Old Standard Life Insurance Company | -- | -- | |
| Gonzales Michael A | -- | None Available | |
| Glover John | -- | None Available | |
| Gonzales Michael A | -- | -- |
Source: Public Records
Mortgage History
| Date | Status | Borrower | Loan Amount |
|---|---|---|---|
| Previous Owner | Glover John | $69,299 |
Source: Public Records
Tax History Compared to Growth
Tax History
| Year | Tax Paid | Tax Assessment Tax Assessment Total Assessment is a certain percentage of the fair market value that is determined by local assessors to be the total taxable value of land and additions on the property. | Land | Improvement |
|---|---|---|---|---|
| 2025 | $2,008 | $42,860 | $5,730 | $37,130 |
| 2024 | $2,008 | $41,612 | $5,563 | $36,049 |
| 2023 | $1,972 | $40,400 | $5,401 | $34,999 |
| 2022 | $1,867 | $39,224 | $5,244 | $33,980 |
| 2021 | $1,805 | $38,081 | $5,091 | $32,990 |
| 2020 | $1,773 | $36,974 | $4,944 | $32,030 |
| 2019 | $1,721 | $35,897 | $4,800 | $31,097 |
| 2018 | $1,663 | $35,897 | $4,800 | $31,097 |
| 2017 | $1,604 | $34,890 | $6,073 | $28,817 |
| 2016 | $1,550 | $32,887 | $5,724 | $27,163 |
| 2015 | $31,930 | $31,930 | $5,558 | $26,372 |
| 2014 | $1,446 | $31,000 | $5,396 | $25,604 |
| 2013 | -- | $30,098 | $5,239 | $24,859 |
Source: Public Records
Map
Nearby Homes
- 711 Lewis Ave SW
- 710 Cromwell Ave SW
- 822 Lewis Ave SW
- 1509 Jesus St SE
- 1105 Broadway Blvd SE
- 815 John St SE
- 234 Southern Ave SE
- 923 Pacific Ave SW
- 701 3rd St SW
- 237 Stover Ave SW
- 233 Stover Ave SW
- 224 Kathryn Ave SE
- 1317 Edith Blvd SE
- 1311 Edith Blvd SE
- 907 Edith Blvd SE
- 313 Iron Ave SW
- 721 Edith Blvd SE
- 615 Iron Ave SW
- 1505 Walter St SE
- 2014 William St SE
- 1429 3rd St SW
- 1501 3rd St SW
- 1505 3rd St SW
- 1421 3rd St SW
- 1502 Barelas Rd SW
- 1509 3rd St SW
- 1500 Barelas Rd SW
- 1504 Barelas Rd SW
- 1424 Barelas Rd SW
- 1430 3rd St SW
- 1500 3rd St SW
- 1424 3rd St SW
- 1422 3rd St SW Unit 4
- 1422 3rd St SW
- 1422 3rd St SW Unit 4
- 1516 3rd St SW
- 1411 3rd St SW
- 1411 3rd St SW Unit 3
- 1516 Barelas Rd SW
- 1418 4th St SW