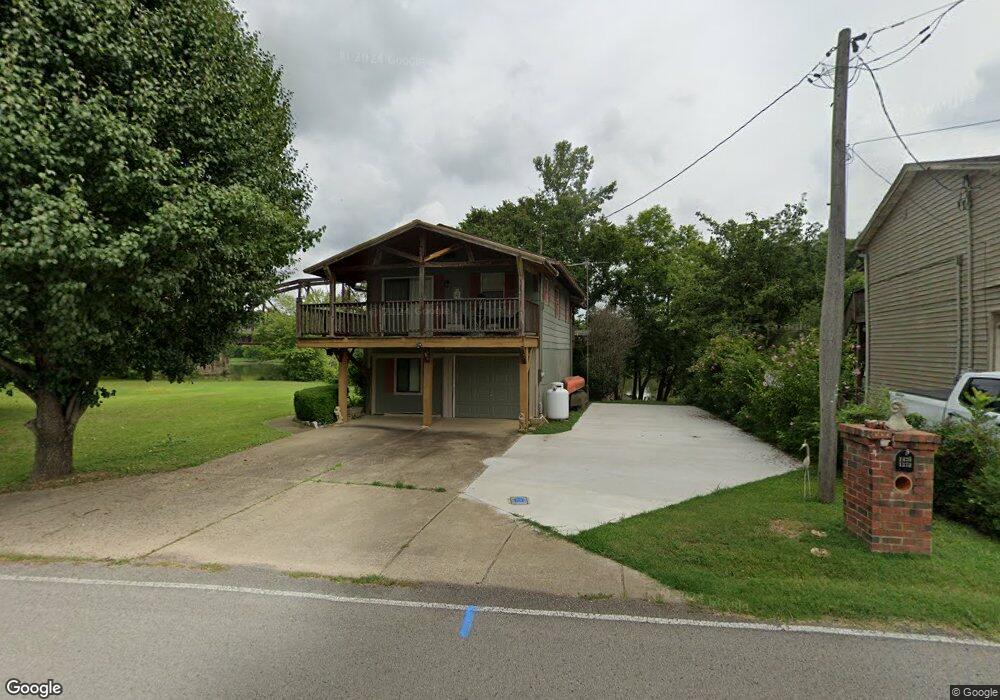
1425 Chapmansboro Rd Chapmansboro, TN 37035
Chapmansboro NeighborhoodEstimated Value: $272,000 - $536,000
--
Bed
2
Baths
640
Sq Ft
$534/Sq Ft
Est. Value
About This Home
This home is located at 1425 Chapmansboro Rd, Chapmansboro, TN 37035 and is currently estimated at $341,582, approximately $533 per square foot. 1425 Chapmansboro Rd is a home located in Cheatham County with nearby schools including West Cheatham Elementary School, Cheatham Middle School, and Cheatham County Central High School.
Ownership History
Date
Name
Owned For
Owner Type
Purchase Details
Closed on
Nov 29, 2010
Sold by
Walker Dee Ann
Bought by
Tilghman Perry A
Current Estimated Value
Purchase Details
Closed on
Apr 21, 2004
Sold by
Jordan Arthur M and Jordan Wanda K
Bought by
Walker Dee Ann
Purchase Details
Closed on
Oct 15, 1992
Bought by
Smiley Stephen and Smiley Patsy A
Purchase Details
Closed on
Sep 19, 1990
Bought by
Soules William R
Purchase Details
Closed on
Sep 7, 1990
Bought by
Mid State Trust Ii
Purchase Details
Closed on
Sep 6, 1990
Bought by
Mid State Trust Ii
Purchase Details
Closed on
Jun 19, 1989
Bought by
Smith Gene
Purchase Details
Closed on
Apr 12, 1989
Bought by
Smith Gene
Purchase Details
Closed on
Feb 3, 1989
Bought by
Engel Virginia A Trustee
Purchase Details
Closed on
Nov 12, 1985
Bought by
James William L
Create a Home Valuation Report for This Property
The Home Valuation Report is an in-depth analysis detailing your home's value as well as a comparison with similar homes in the area
Home Values in the Area
Average Home Value in this Area
Purchase History
| Date | Buyer | Sale Price | Title Company |
|---|---|---|---|
| Tilghman Perry A | $80,000 | -- | |
| Walker Dee Ann | $130,000 | -- | |
| Smiley Stephen | $35,000 | -- | |
| Soules William R | $22,000 | -- | |
| Mid State Trust Ii | $500 | -- | |
| Mid State Trust Ii | -- | -- | |
| Smith Gene | -- | -- | |
| Smith Gene | -- | -- | |
| Engel Virginia A Trustee | -- | -- | |
| James William L | -- | -- |
Source: Public Records
Tax History Compared to Growth
Tax History
| Year | Tax Paid | Tax Assessment Tax Assessment Total Assessment is a certain percentage of the fair market value that is determined by local assessors to be the total taxable value of land and additions on the property. | Land | Improvement |
|---|---|---|---|---|
| 2025 | $957 | $55,275 | $0 | $0 |
| 2024 | $957 | $55,275 | $19,625 | $35,650 |
| 2023 | $824 | $30,300 | $5,250 | $25,050 |
| 2022 | $824 | $30,300 | $5,250 | $25,050 |
| 2021 | $824 | $30,300 | $5,250 | $25,050 |
| 2020 | $815 | $30,300 | $5,250 | $25,050 |
| 2019 | $815 | $30,300 | $5,250 | $25,050 |
| 2018 | $671 | $21,275 | $5,000 | $16,275 |
| 2017 | $635 | $21,275 | $5,000 | $16,275 |
| 2016 | $604 | $21,275 | $5,000 | $16,275 |
| 2015 | $586 | $19,350 | $5,000 | $14,350 |
| 2014 | $586 | $19,350 | $5,000 | $14,350 |
Source: Public Records
Map
Nearby Homes
- 1341 Chapmansboro Rd
- Lot 5 Matlock Dr
- 1001 Cumberland Dr
- 1 Highway 12 N
- 4 Highway 12 N
- 432 Slow Roll Dr
- 0 Aresti Dr
- 702 Cherrywood Ct
- 392 Feather Ridge Rd
- 1032 Lockridge Ln
- 2789 Highway 12 N
- 0 Bobbitt Rd
- 501 Chapmansboro Rd
- 1719 Wynnewood Dr
- 3257 Ashland City Hwy
- 0 Hwy 49 W
- 2863 Sweethome Rd
- 0 Hwy 49 E Unit RTC2641595
- 2894 Sweethome Rd
- 2898 Sweethome Rd
- 1427 Chapmansboro Rd
- 1427 Chapmansboro Rd
- 1375 Chapmansboro Rd
- 1423 Chapmansboro Rd
- 1431 Chapmansboro Rd
- 1419 Chapmansboro Rd
- 1421 Chapmansboro Rd
- 1390 Chapmansboro Rd
- 1353 Chapmansboro Rd
- 1417 Chapmansboro Rd
- 1413 Chapmansboro Rd
- 1411 Chapmansboro Rd
- 1409 Chapmansboro Rd
- 1455 Chapmansboro Rd
- 1455 Chapmansboro Rd
- 1407 Chapmansboro Rd
- 1456 Chapmansboro Rd
- 1333 Chapmansboro Rd
- 1405 Chapmansboro Rd
- 1459 Chapmansboro Rd