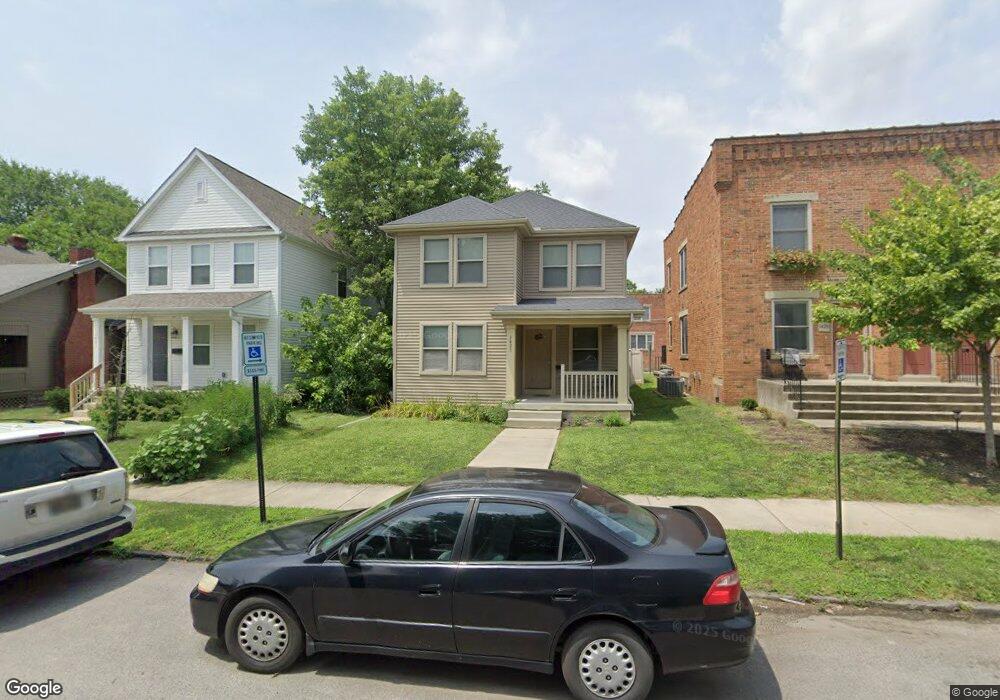
1425 N 5th St Columbus, OH 43201
Weinland Park NeighborhoodEstimated Value: $221,000 - $336,000
4
Beds
2
Baths
1,718
Sq Ft
$163/Sq Ft
Est. Value
About This Home
This home is located at 1425 N 5th St, Columbus, OH 43201 and is currently estimated at $280,569, approximately $163 per square foot. 1425 N 5th St is a home with nearby schools including Weinland Park Elementary School, Dominion Middle School, and Whetstone High School.
Ownership History
Date
Name
Owned For
Owner Type
Purchase Details
Closed on
Mar 1, 2011
Sold by
Urban Revival Llc
Bought by
Weinland Park Homes Llc
Current Estimated Value
Home Financials for this Owner
Home Financials are based on the most recent Mortgage that was taken out on this home.
Original Mortgage
$153,000
Outstanding Balance
$103,888
Interest Rate
4.85%
Mortgage Type
Future Advance Clause Open End Mortgage
Estimated Equity
$176,681
Purchase Details
Closed on
Jul 20, 2010
Sold by
Northside Development Corporation
Bought by
Urban Revival Llc
Purchase Details
Closed on
Jul 29, 1998
Sold by
Swayne Charlie L
Bought by
Northside Development Corp
Purchase Details
Closed on
Nov 1, 1986
Create a Home Valuation Report for This Property
The Home Valuation Report is an in-depth analysis detailing your home's value as well as a comparison with similar homes in the area
Home Values in the Area
Average Home Value in this Area
Purchase History
| Date | Buyer | Sale Price | Title Company |
|---|---|---|---|
| Weinland Park Homes Llc | $25,000 | Arrow Title | |
| Urban Revival Llc | $25,000 | Principle T | |
| Northside Development Corp | $3,900 | -- | |
| -- | $28,500 | -- |
Source: Public Records
Mortgage History
| Date | Status | Borrower | Loan Amount |
|---|---|---|---|
| Open | Weinland Park Homes Llc | $153,000 |
Source: Public Records
Tax History
| Year | Tax Paid | Tax Assessment Tax Assessment Total Assessment is a certain percentage of the fair market value that is determined by local assessors to be the total taxable value of land and additions on the property. | Land | Improvement |
|---|---|---|---|---|
| 2025 | $765 | $47,260 | $16,700 | $30,560 |
| 2024 | $765 | $47,260 | $16,700 | $30,560 |
| 2023 | $756 | $47,260 | $16,700 | $30,560 |
| 2022 | $357 | $28,180 | $6,720 | $21,460 |
| 2021 | $358 | $28,180 | $6,720 | $21,460 |
| 2020 | $358 | $28,180 | $6,720 | $21,460 |
| 2019 | $418 | $28,180 | $6,720 | $21,460 |
| 2018 | $399 | $28,180 | $6,720 | $21,460 |
| 2017 | $418 | $28,180 | $6,720 | $21,460 |
| 2016 | $419 | $20,230 | $6,160 | $14,070 |
| 2015 | $381 | $20,230 | $6,160 | $14,070 |
| 2014 | $382 | $20,230 | $6,160 | $14,070 |
| 2013 | $562 | $18,375 | $5,600 | $12,775 |
Source: Public Records
Map
Nearby Homes
- 1411 N 5th St
- 1376 N 6th St
- 1440-1442 Hamlet St
- 1336 N 5th St Unit 338
- 1342 Hamlet St Unit 344
- 1291 N Grant Ave
- 1239 Cromartie Ln
- 1233 Cromartie Ln
- 1222 N Grant Ave Unit H
- 249 E Greenwood Ave
- 289 E Greenwood Ave
- 1158 Summit St
- 1152 Summit St
- 288 E 4th Ave
- 156 E 4th Ave
- 138 E Greenwood Ave
- 76 Chittenden Ave
- 1151 Summit St
- 1149 Summit St
- 408 E 14th Ave
- 1421 N 5th St
- 1417 N 5th St
- 1411-1413 N 5th St
- 1407 N 5th St Unit 409
- 1438 N 5th St Unit 4
- 1438 N 5th St
- 1428 N 5th St Unit 430
- 1434 N 5th St Unit 436
- 1414 N 5th St Unit 416
- 1449 N 5th St
- 1424 N 4th St
- 1424 N 4th St Unit 1424 & 1424 1/2
- 1428 N 4th St Unit 432
- 1418 N 4th St Unit 420
- 1424 1/2 N 4th St
- 104 N Test St
- 1416 N 4th St
- 299 E 9th Ave
- 1396 N 5th St
- 1400 N 5th St
Your Personal Tour Guide
Ask me questions while you tour the home.