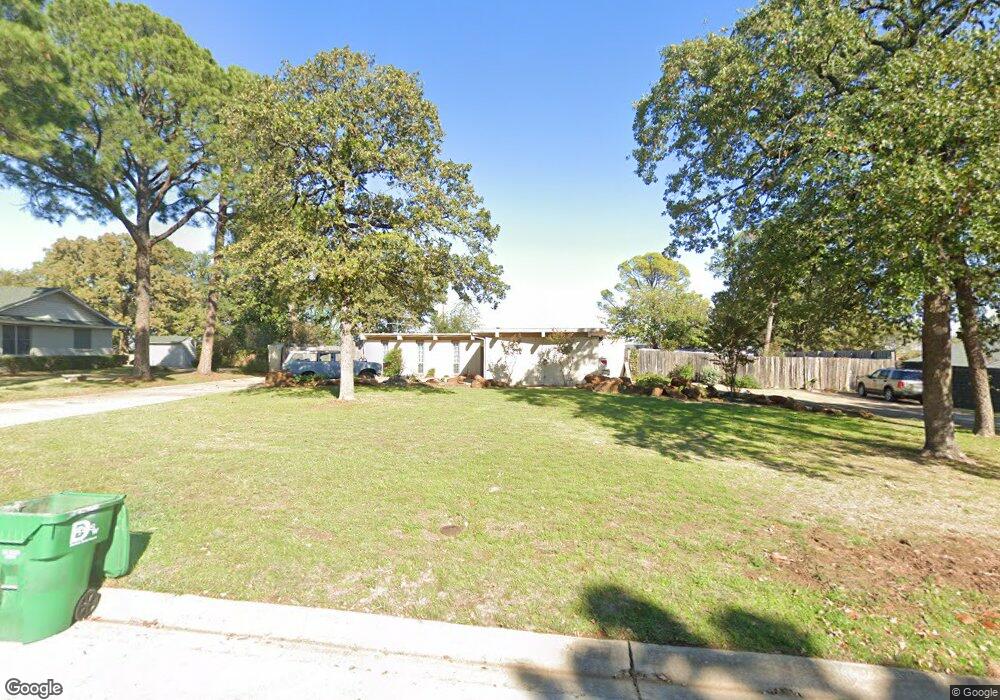
1425 Ridgecrest Cir Denton, TX 76205
South Denton NeighborhoodEstimated Value: $488,866 - $532,000
3
Beds
3
Baths
2,586
Sq Ft
$199/Sq Ft
Est. Value
About This Home
This home is located at 1425 Ridgecrest Cir, Denton, TX 76205 and is currently estimated at $515,717, approximately $199 per square foot. 1425 Ridgecrest Cir is a home located in Denton County with nearby schools including Houston Elementary School, McMath Middle School, and Denton High School.
Ownership History
Date
Name
Owned For
Owner Type
Purchase Details
Closed on
Aug 23, 2018
Sold by
Cerralvo Frank J
Bought by
Starkey Betty
Current Estimated Value
Purchase Details
Closed on
Apr 30, 2014
Sold by
Hatfield Marilyn R and Hatfield David B
Bought by
Suo Anttila Jeremy
Home Financials for this Owner
Home Financials are based on the most recent Mortgage that was taken out on this home.
Original Mortgage
$230,400
Interest Rate
4.36%
Mortgage Type
Purchase Money Mortgage
Purchase Details
Closed on
Feb 27, 2004
Sold by
Federal National Mortgage Association
Bought by
Hatfield David B and Hatfield Marilyn R
Home Financials for this Owner
Home Financials are based on the most recent Mortgage that was taken out on this home.
Original Mortgage
$109,650
Interest Rate
2.95%
Mortgage Type
Purchase Money Mortgage
Purchase Details
Closed on
Dec 2, 2003
Sold by
Hansen William Peat
Bought by
Federal National Mortgage Association
Create a Home Valuation Report for This Property
The Home Valuation Report is an in-depth analysis detailing your home's value as well as a comparison with similar homes in the area
Home Values in the Area
Average Home Value in this Area
Purchase History
| Date | Buyer | Sale Price | Title Company |
|---|---|---|---|
| Starkey Betty | -- | None Available | |
| Suo Anttila Jeremy | -- | Allegiance Title Co | |
| Hatfield David B | -- | Stewart Title Dallas | |
| Federal National Mortgage Association | $138,495 | -- |
Source: Public Records
Mortgage History
| Date | Status | Borrower | Loan Amount |
|---|---|---|---|
| Previous Owner | Suo Anttila Jeremy | $230,400 | |
| Previous Owner | Hatfield David B | $109,650 |
Source: Public Records
Tax History Compared to Growth
Tax History
| Year | Tax Paid | Tax Assessment Tax Assessment Total Assessment is a certain percentage of the fair market value that is determined by local assessors to be the total taxable value of land and additions on the property. | Land | Improvement |
|---|---|---|---|---|
| 2025 | $6,548 | $400,777 | $153,425 | $247,352 |
| 2024 | $7,743 | $401,163 | $0 | $0 |
| 2023 | $5,767 | $364,694 | $153,425 | $260,683 |
| 2022 | $7,038 | $331,540 | $135,375 | $257,905 |
| 2021 | $6,700 | $317,122 | $90,250 | $226,872 |
| 2020 | $6,263 | $274,000 | $90,250 | $183,750 |
| 2019 | $6,534 | $273,825 | $90,250 | $183,575 |
| 2018 | $6,281 | $260,000 | $90,250 | $169,750 |
| 2017 | $6,801 | $275,137 | $90,250 | $184,887 |
| 2016 | $6,230 | $254,100 | $90,250 | $163,850 |
| 2015 | $5,026 | $241,076 | $90,250 | $150,826 |
| 2013 | -- | $214,546 | $99,278 | $115,268 |
Source: Public Records
Map
Nearby Homes
- 1412 Ridgecrest Cir
- 209 Pennsylvania Dr
- 2218 Southridge Dr
- 2272 Hollyhill Ln
- 2253 Hollyhill Ln
- 924 Ridgecrest Cir
- 1541 Valley Creek Rd
- 1500 Sandy Creek Dr
- 2544 Natchez Trace
- 1536 Valley Creek Rd
- 2012 Hollyhill Ln
- 1517 Valley Creek Rd
- 408 Hollyhill Ln
- 412 Hollyhill Ln Unit 412
- 1512 Valley Creek Rd
- 1501 Valley Creek Rd
- 2501 Great Bear Ln
- 916 Smokerise Cir
- 1508 Kenwood St
- 1000 Lynhurst Ln
- 1427 Ridgecrest Cir
- 1419 Ridgecrest Cir
- 1429 Ridgecrest Cir
- 1428 Ridgecrest Cir
- 1424 Ridgecrest Cir
- 1418 Ridgecrest Cir
- 1407 Ridgecrest Cir
- 1500 Ridgecrest Cir
- 2303 Conway Ln
- 2301 Conway Ln
- 601 Ridgecrest Cir
- 1501 Ridgecrest Cir
- 605 Ridgecrest Cir
- 525 Ridgecrest Cir
- 1507 Ridgecrest Cir
- 1505 Ridgecrest Cir
- 1406 Ridgecrest Cir
- 517 Ridgecrest Cir
- 117 Lexington Ln
- 615 Ridgecrest Cir