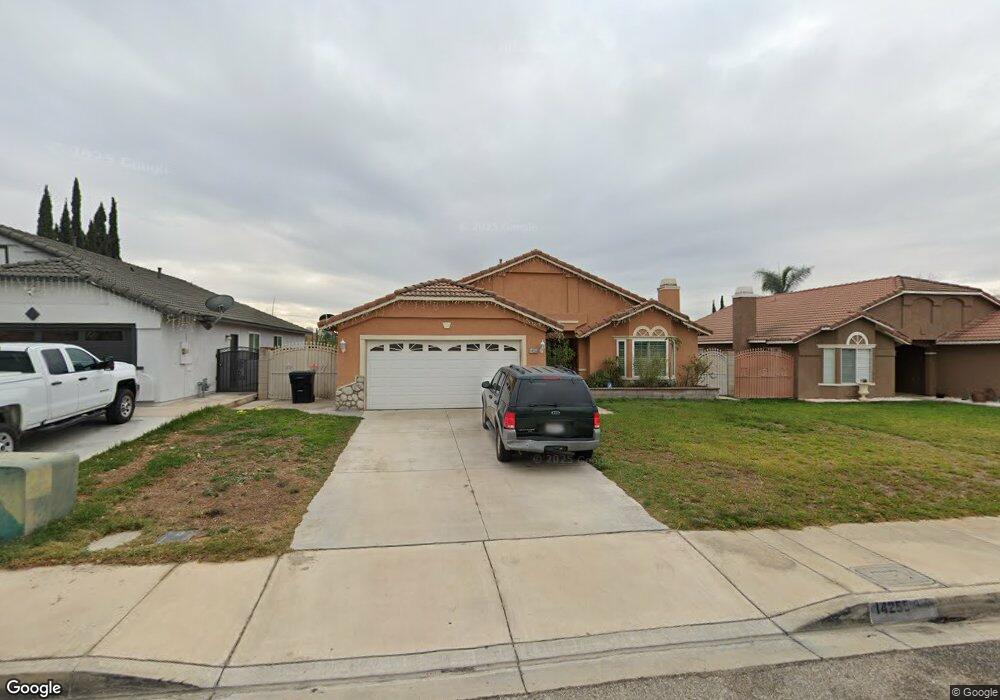
14255 Upas Ct Fontana, CA 92335
Estimated Value: $626,631 - $665,000
4
Beds
2
Baths
1,690
Sq Ft
$382/Sq Ft
Est. Value
About This Home
This home is located at 14255 Upas Ct, Fontana, CA 92335 and is currently estimated at $645,408, approximately $381 per square foot. 14255 Upas Ct is a home located in San Bernardino County with nearby schools including Almond Elementary School, Sequoia Middle School, and Summit High School.
Ownership History
Date
Name
Owned For
Owner Type
Purchase Details
Closed on
Apr 6, 2007
Sold by
Lua Jose Luis
Bought by
Lua Susana
Current Estimated Value
Home Financials for this Owner
Home Financials are based on the most recent Mortgage that was taken out on this home.
Original Mortgage
$261,500
Outstanding Balance
$157,675
Interest Rate
6.1%
Mortgage Type
New Conventional
Estimated Equity
$487,733
Purchase Details
Closed on
Mar 24, 2005
Sold by
Lua Jose Luis and Lua Susana
Bought by
Lua Jose Luis and Lua Susana
Home Financials for this Owner
Home Financials are based on the most recent Mortgage that was taken out on this home.
Original Mortgage
$244,800
Interest Rate
6.35%
Mortgage Type
Purchase Money Mortgage
Purchase Details
Closed on
Jul 21, 1998
Sold by
Parvin Construction Company Inc
Bought by
Lua Jose Luis and Lua Susana
Home Financials for this Owner
Home Financials are based on the most recent Mortgage that was taken out on this home.
Original Mortgage
$140,491
Interest Rate
6.9%
Mortgage Type
FHA
Create a Home Valuation Report for This Property
The Home Valuation Report is an in-depth analysis detailing your home's value as well as a comparison with similar homes in the area
Home Values in the Area
Average Home Value in this Area
Purchase History
| Date | Buyer | Sale Price | Title Company |
|---|---|---|---|
| Lua Susana | -- | Investors Title Company | |
| Lua Jose Luis | -- | Alliance Title | |
| Lua Jose Luis | $143,000 | Orange Coast Title |
Source: Public Records
Mortgage History
| Date | Status | Borrower | Loan Amount |
|---|---|---|---|
| Open | Lua Susana | $261,500 | |
| Closed | Lua Jose Luis | $244,800 | |
| Closed | Lua Jose Luis | $140,491 |
Source: Public Records
Tax History Compared to Growth
Tax History
| Year | Tax Paid | Tax Assessment Tax Assessment Total Assessment is a certain percentage of the fair market value that is determined by local assessors to be the total taxable value of land and additions on the property. | Land | Improvement |
|---|---|---|---|---|
| 2025 | $2,397 | $236,984 | $56,124 | $180,860 |
| 2024 | $2,397 | $232,338 | $55,024 | $177,314 |
| 2023 | $2,334 | $227,782 | $53,945 | $173,837 |
| 2022 | $2,324 | $223,315 | $52,887 | $170,428 |
| 2021 | $2,293 | $218,936 | $51,850 | $167,086 |
| 2020 | $2,287 | $216,691 | $51,318 | $165,373 |
| 2019 | $2,216 | $212,442 | $50,312 | $162,130 |
| 2018 | $2,248 | $208,276 | $49,325 | $158,951 |
| 2017 | $2,234 | $204,192 | $48,358 | $155,834 |
| 2016 | $2,195 | $200,188 | $47,410 | $152,778 |
| 2015 | $2,166 | $197,181 | $46,698 | $150,483 |
| 2014 | $2,161 | $193,318 | $45,783 | $147,535 |
Source: Public Records
Map
Nearby Homes
- 14418 Bing Ave
- 14412 Bing Ave
- 14408 Bing Ave
- 8316 Reseda Ave
- 14424 Bing Ave
- 14428 Bing Ave
- 14432 Bing Ave
- 13868 Lexus Ln
- 14093 Marbella St
- 14718 Valencia Ave
- 13841 Cobblestone Ct
- 8043 Tuscany St
- 14219 Point Loma St
- 14783 Ivy Ave
- 13681 Lexus Ln
- 14084 Rothchild Ct
- 14028 Yorktown Ct
- 13512 Arrow Blvd
- 8221 Ilex St Unit 23
- 8221 Ilex St Unit 10
- 14265 Upas Ct
- 14245 Upas Ct
- 14275 Upas Ct
- 14235 Upas Ct
- 8422 Chenille Ct
- 14285 Upas Ct
- 8411 Paisley Ln
- 8444 Paisley Ln
- 8412 Chenille Ct
- 8401 Paisley Ln
- 8454 Almond Ave Unit A
- 8454 Almond Ave
- 14295 Upas Ct
- 8466 Almond Ave Unit B
- 8466 Almond Ave Unit A
- 8466 Almond Ave
- 8418 Almond Ave
- 8434 Paisley Ln
- 8402 Chenille Ct
- 8391 Paisley Ln