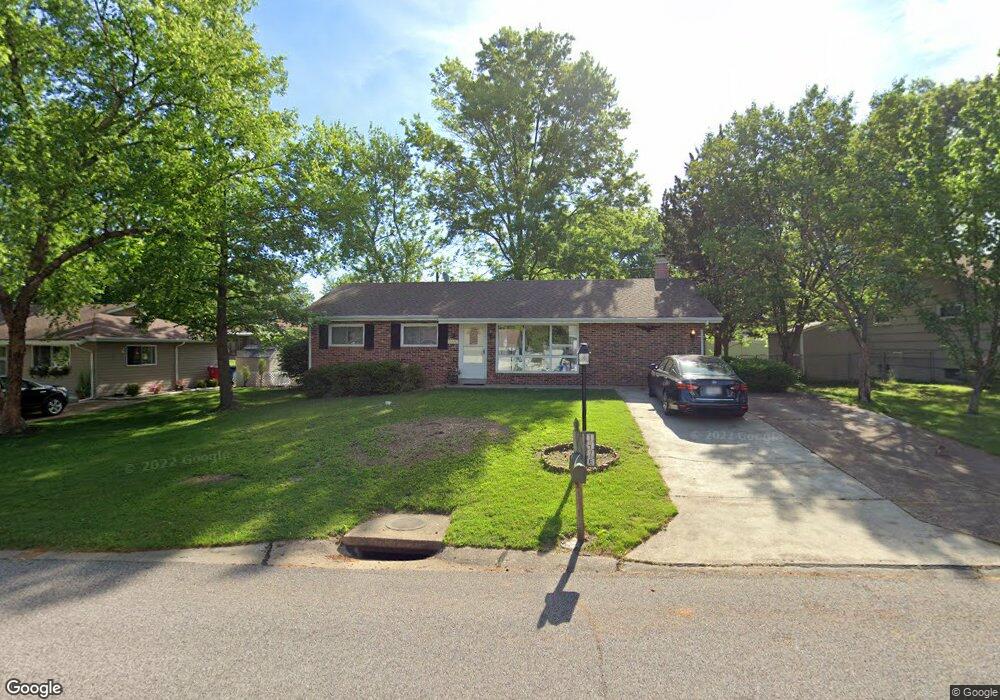
1426 Homecrest Dr Saint Louis, MO 63127
Estimated Value: $210,000 - $304,574
3
Beds
3
Baths
1,274
Sq Ft
$215/Sq Ft
Est. Value
About This Home
This home is located at 1426 Homecrest Dr, Saint Louis, MO 63127 and is currently estimated at $274,144, approximately $215 per square foot. 1426 Homecrest Dr is a home located in St. Louis County with nearby schools including Crestwood Elementary School, Truman Middle School, and Lindbergh High School.
Ownership History
Date
Name
Owned For
Owner Type
Purchase Details
Closed on
Sep 4, 2013
Sold by
Castle Partners Llc
Bought by
Becker Robert J and Becker Naomi J
Current Estimated Value
Home Financials for this Owner
Home Financials are based on the most recent Mortgage that was taken out on this home.
Original Mortgage
$68,000
Outstanding Balance
$50,663
Interest Rate
4.36%
Mortgage Type
Future Advance Clause Open End Mortgage
Estimated Equity
$223,481
Purchase Details
Closed on
Jul 30, 2013
Sold by
Moss Morris C and Bell Saretta
Bought by
Castle Partners Llc
Home Financials for this Owner
Home Financials are based on the most recent Mortgage that was taken out on this home.
Original Mortgage
$68,000
Outstanding Balance
$50,663
Interest Rate
4.36%
Mortgage Type
Future Advance Clause Open End Mortgage
Estimated Equity
$223,481
Purchase Details
Closed on
Jul 3, 2010
Sold by
Moss Morris C
Bought by
Moss Morris C and Bell Saretta
Create a Home Valuation Report for This Property
The Home Valuation Report is an in-depth analysis detailing your home's value as well as a comparison with similar homes in the area
Home Values in the Area
Average Home Value in this Area
Purchase History
| Date | Buyer | Sale Price | Title Company |
|---|---|---|---|
| Becker Robert J | $85,000 | Security Title Ins Agency Cm | |
| Castle Partners Llc | $65,000 | Security Title Insurance Age | |
| Moss Morris C | -- | None Available |
Source: Public Records
Mortgage History
| Date | Status | Borrower | Loan Amount |
|---|---|---|---|
| Open | Becker Robert J | $68,000 |
Source: Public Records
Tax History Compared to Growth
Tax History
| Year | Tax Paid | Tax Assessment Tax Assessment Total Assessment is a certain percentage of the fair market value that is determined by local assessors to be the total taxable value of land and additions on the property. | Land | Improvement |
|---|---|---|---|---|
| 2025 | $3,222 | $52,810 | $21,740 | $31,070 |
| 2024 | $3,222 | $49,120 | $13,970 | $35,150 |
| 2023 | $3,213 | $49,120 | $13,970 | $35,150 |
| 2022 | $2,663 | $36,190 | $15,500 | $20,690 |
| 2021 | $2,359 | $39,350 | $15,500 | $23,850 |
| 2020 | $2,296 | $33,980 | $13,970 | $20,010 |
| 2019 | $2,290 | $33,980 | $13,970 | $20,010 |
| 2018 | $2,186 | $29,510 | $8,740 | $20,770 |
| 2017 | $2,162 | $29,510 | $8,740 | $20,770 |
| 2016 | $1,762 | $22,840 | $7,790 | $15,050 |
| 2015 | $1,770 | $22,840 | $7,790 | $15,050 |
| 2014 | $2,089 | $26,700 | $3,820 | $22,880 |
Source: Public Records
Map
Nearby Homes
- 1412 Windward Ridge Dr
- 421 Spears St
- 362 Memphis St
- 338 Memphis St
- 367 Memphis St
- 1305 Spellman Ave
- 343 Memphis St
- 322 Chicago St
- 318 Chicago St
- 301 Memphis St
- 556 Joshua Dr
- 119 Monica Dr
- 118 Monica Dr
- 8726 Gayle Ave
- 10225 E Watson Rd
- 740 Montego Dr
- 1120 Tahiti Dr
- 745 Montego Dr
- 503 Acorn Dr
- 341 New York St
- 1432 Homecrest Dr
- 1420 Homecrest Dr
- 1421 Starling Dr
- 1413 Starling Dr
- 1427 Homecrest Dr
- 1421 Homecrest Dr
- 1414 Homecrest Dr
- 1438 Homecrest Dr
- 1425 Starling Dr
- 415 Homecrest Dr
- 1415 Homecrest Dr
- 1405 Starling Dr
- 1503 Starling Dr
- 1424 Windward Ridge Dr
- 1418 Windward Ridge Dr
- 424 Homecrest Dr
- 1407 Homecrest Dr
- 407 Homecrest Dr
- 501 Lodge Dr
- 420 Homecrest Dr