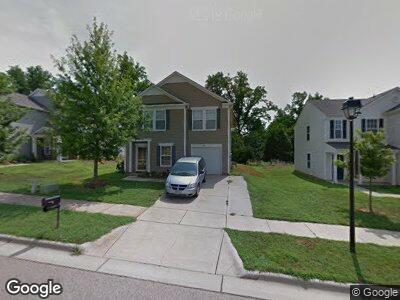
1426 Matthew Allen Cir Kannapolis, NC 28081
Estimated Value: $329,000 - $382,000
3
Beds
3
Baths
2,602
Sq Ft
$140/Sq Ft
Est. Value
About This Home
This home is located at 1426 Matthew Allen Cir, Kannapolis, NC 28081 and is currently estimated at $363,121, approximately $139 per square foot. 1426 Matthew Allen Cir is a home located in Cabarrus County with nearby schools including Winecoff Elementary School, Northwest Cabarrus Middle School, and Northwest Cabarrus High.
Ownership History
Date
Name
Owned For
Owner Type
Purchase Details
Closed on
Jul 3, 2013
Sold by
Vanallen William Van and Vanallen Angela Van
Bought by
Scott Jamecia
Current Estimated Value
Home Financials for this Owner
Home Financials are based on the most recent Mortgage that was taken out on this home.
Original Mortgage
$132,014
Interest Rate
4.4%
Mortgage Type
FHA
Purchase Details
Closed on
Oct 2, 2006
Sold by
C P Morgan Communities Of Charlotte Llc
Bought by
Vanallen William and Vanallen Van Allen
Home Financials for this Owner
Home Financials are based on the most recent Mortgage that was taken out on this home.
Original Mortgage
$120,800
Interest Rate
6.46%
Mortgage Type
Purchase Money Mortgage
Purchase Details
Closed on
Sep 26, 2005
Sold by
Craft Homes Usa Llc
Bought by
Cp Morgan Communities Of Charlotte Llc
Create a Home Valuation Report for This Property
The Home Valuation Report is an in-depth analysis detailing your home's value as well as a comparison with similar homes in the area
Home Values in the Area
Average Home Value in this Area
Purchase History
| Date | Buyer | Sale Price | Title Company |
|---|---|---|---|
| Scott Jamecia | $135,000 | None Available | |
| Vanallen William | $151,500 | None Available | |
| Cp Morgan Communities Of Charlotte Llc | $107,000 | -- |
Source: Public Records
Mortgage History
| Date | Status | Borrower | Loan Amount |
|---|---|---|---|
| Open | Scott Jamecia | $45,199 | |
| Closed | Scott Jamccia | $39,000 | |
| Closed | Scott Jamecia | $19,388 | |
| Closed | Scott Jamecia | $16,418 | |
| Open | Scott Jamecia | $130,317 | |
| Closed | Scott Jamecia | $132,014 | |
| Previous Owner | Vanallen William | $120,800 |
Source: Public Records
Tax History Compared to Growth
Tax History
| Year | Tax Paid | Tax Assessment Tax Assessment Total Assessment is a certain percentage of the fair market value that is determined by local assessors to be the total taxable value of land and additions on the property. | Land | Improvement |
|---|---|---|---|---|
| 2024 | $3,966 | $349,270 | $65,000 | $284,270 |
| 2023 | $2,762 | $201,630 | $38,000 | $163,630 |
| 2022 | $2,762 | $201,630 | $38,000 | $163,630 |
| 2021 | $2,762 | $201,630 | $38,000 | $163,630 |
| 2020 | $2,762 | $201,630 | $38,000 | $163,630 |
| 2019 | $2,062 | $150,520 | $20,000 | $130,520 |
| 2018 | $2,032 | $150,520 | $20,000 | $130,520 |
| 2017 | $2,002 | $150,520 | $20,000 | $130,520 |
| 2016 | $2,002 | $146,970 | $23,000 | $123,970 |
| 2015 | -- | $146,970 | $23,000 | $123,970 |
| 2014 | -- | $146,970 | $23,000 | $123,970 |
Source: Public Records
Map
Nearby Homes
- 1613 Frederick Ave
- 1505 S Ridge Ave
- 303 Windy Rush Rd
- 125 Lowrance Ave
- 1412 Meadow Ave
- 602 Black Maple Dr
- 1216 Innis Ave
- 681 Pine Bluff Cir
- 308 Odell Dr
- 1425 Wildwood Dr
- 123 Carriage House Dr
- 103 Carriage House Dr
- 1311 Meadow Ave
- 503 Eddleman Rd
- 2123 Carriage Woods Ln
- 1309 Meadow Ave
- 206 Cliffside Dr
- 308 Dakota St
- 410 Glass Ct
- 1105 Horton Ave
- 1426 Matthew Allen Cir
- 1420 Matthew Allen Cir
- 1432 Matthew Allen Cir
- 1414 Matthew Allen Cir
- 1438 Matthew Allen Cir
- 1408 Matthew Allen Cir
- 1444 Matthew Allen Cir
- 1478 Matthew Allen Cir
- 1427 Matthew Allen Cir
- 1433 Matthew Allen Cir
- 1421 Matthew Allen Cir
- 1450 Matthew Allen Cir
- 1439 Matthew Allen Cir
- 1415 Matthew Allen Cir
- 1445 Matthew Allen Cir
- 1409 Matthew Allen Cir
- 1456 Matthew Allen Cir
- 1451 Matthew Allen Cir
- 1405 Matthew Allen Cir
- 1401 Matthew Allen Cir