1426 Tristram Cir Unit 1426 Mantua, NJ 08051
Mantua Township NeighborhoodEstimated Value: $205,000 - $222,000
--
Bed
--
Bath
872
Sq Ft
$246/Sq Ft
Est. Value
About This Home
This home is located at 1426 Tristram Cir Unit 1426, Mantua, NJ 08051 and is currently estimated at $214,348, approximately $245 per square foot. 1426 Tristram Cir Unit 1426 is a home located in Gloucester County with nearby schools including Centre City School, Clearview Regional Middle School, and Clearview Regional High School.
Ownership History
Date
Name
Owned For
Owner Type
Purchase Details
Closed on
Apr 24, 2002
Sold by
Ott Joseph and Ott Melissa J
Bought by
Henk Michael
Current Estimated Value
Home Financials for this Owner
Home Financials are based on the most recent Mortgage that was taken out on this home.
Original Mortgage
$59,200
Interest Rate
7.18%
Purchase Details
Closed on
Jun 25, 1999
Sold by
Fear Frank W
Bought by
Ott Joseph
Home Financials for this Owner
Home Financials are based on the most recent Mortgage that was taken out on this home.
Original Mortgage
$68,300
Interest Rate
7.49%
Mortgage Type
FHA
Purchase Details
Closed on
Jul 25, 1997
Sold by
Berkley Associates Llc
Bought by
Fear Frank W
Home Financials for this Owner
Home Financials are based on the most recent Mortgage that was taken out on this home.
Original Mortgage
$63,450
Interest Rate
7.55%
Mortgage Type
FHA
Create a Home Valuation Report for This Property
The Home Valuation Report is an in-depth analysis detailing your home's value as well as a comparison with similar homes in the area
Home Values in the Area
Average Home Value in this Area
Purchase History
| Date | Buyer | Sale Price | Title Company |
|---|---|---|---|
| Henk Michael | $74,000 | Fidelity National Title Ins | |
| Ott Joseph | $69,900 | Independence Abstract & Titl | |
| Fear Frank W | $68,990 | Settlers Title Agency Lp |
Source: Public Records
Mortgage History
| Date | Status | Borrower | Loan Amount |
|---|---|---|---|
| Closed | Henk Michael | $59,200 | |
| Previous Owner | Ott Joseph | $68,300 | |
| Previous Owner | Fear Frank W | $63,450 |
Source: Public Records
Tax History Compared to Growth
Tax History
| Year | Tax Paid | Tax Assessment Tax Assessment Total Assessment is a certain percentage of the fair market value that is determined by local assessors to be the total taxable value of land and additions on the property. | Land | Improvement |
|---|---|---|---|---|
| 2025 | $4,063 | $157,800 | $50,000 | $107,800 |
| 2024 | $4,021 | $157,800 | $50,000 | $107,800 |
| 2023 | $4,021 | $157,800 | $50,000 | $107,800 |
| 2022 | $3,411 | $97,500 | $40,000 | $57,500 |
| 2021 | $3,173 | $97,500 | $40,000 | $57,500 |
| 2020 | $3,409 | $97,500 | $40,000 | $57,500 |
| 2019 | $3,351 | $97,500 | $40,000 | $57,500 |
| 2018 | $3,303 | $97,500 | $40,000 | $57,500 |
| 2017 | $3,254 | $97,500 | $40,000 | $57,500 |
| 2016 | $3,217 | $97,500 | $40,000 | $57,500 |
| 2015 | $3,855 | $119,800 | $40,000 | $79,800 |
| 2014 | $3,726 | $119,800 | $40,000 | $79,800 |
Source: Public Records
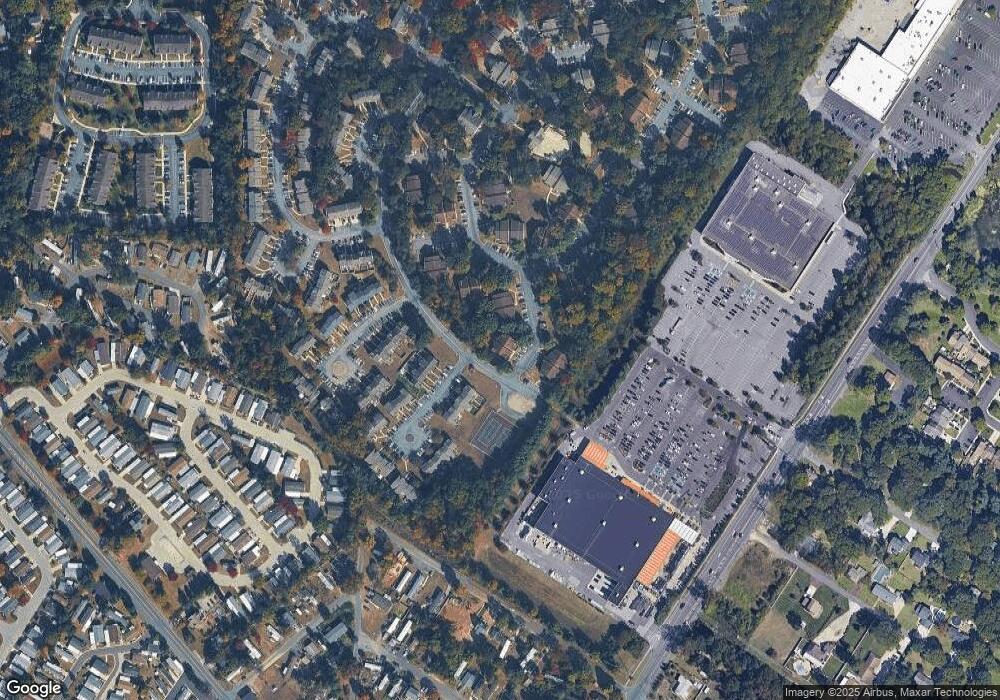
Map
Nearby Homes
- 1433 Tristram Cir
- 261 Tony Cir
- 325 Bridgeton Pike
- 19 Marathon Dr
- 1147 Tristram Cir Unit 1147
- 1145 Tristram Cir
- 1215 Tristram Cir
- 204 W Landing Rd
- 1134 Tristram Cir Unit 4
- 205 Redbud Ln Unit 205
- 8 Barry Dr
- 131 Firth Dr
- 485 Harrison Ave
- 433 Berkley Rd
- 36 Bluebird Rd
- 190 Mockingbird Ln
- 119 Monroe Ave
- 106 Firth Dr
- 155 Whippoorwill Way
- 465 Berkley Rd
- 1427 Tristram Cir Unit 1427
- 1425 Tristram Cir
- 1420 Tristram Cir Unit 1420
- 1424 Tristram Cir Unit 1424
- 1423 Tristram Cir Unit 1423
- 1421 Tristram Cir Unit 1421
- 1422 Tristram Cir Unit 1422
- 1416 Tristram Cir Unit 1416
- 1417 Tristram Cir Unit 1417
- 1414 Tristram Cir Unit 1414
- 1413 Tristram Cir Unit 1413
- 701 Quest Ct Unit 701
- 1437 Tristram Cir Unit 1437
- 1430 Tristram Cir Unit 1430
- 1412 Tristram Cir Unit 1412
- 1436 Tristram Cir Unit 1392
- 703 Quest Ct
- 1431 Tristram Cir Unit 1431
- 1435 Tristram Cir Unit 1435
- 1335 Tristram Cir Unit 1335