Estimated Value: $1,392,963 - $1,660,000
3
Beds
2
Baths
2,319
Sq Ft
$676/Sq Ft
Est. Value
About This Home
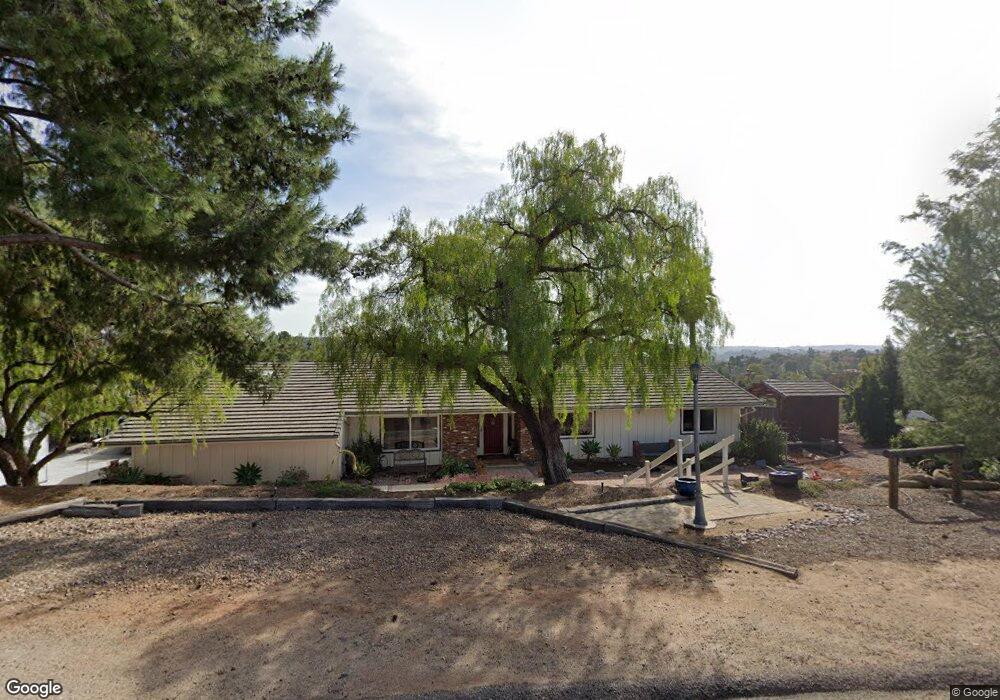
This home is located at 14265 Hacienda Ln, Poway, CA 92064 and is currently estimated at $1,568,741, approximately $676 per square foot. 14265 Hacienda Ln is a home located in San Diego County with nearby schools including Tierra Bonita Elementary, Twin Peaks Middle, and Poway High.
Ownership History
Date
Name
Owned For
Owner Type
Purchase Details
Closed on
Nov 13, 2015
Sold by
Pescatore Robert A and Pescatore Colleen E
Bought by
The Robert & Colleen Pescatore Family Tr
Current Estimated Value
Purchase Details
Closed on
Aug 17, 2011
Sold by
Mozina Jerome
Bought by
Pescatore Robert A and Pescatore Colleen E
Home Financials for this Owner
Home Financials are based on the most recent Mortgage that was taken out on this home.
Original Mortgage
$588,800
Outstanding Balance
$401,738
Interest Rate
4.26%
Mortgage Type
VA
Estimated Equity
$1,167,003
Purchase Details
Closed on
Nov 4, 2004
Sold by
Mozina Jerome D
Bought by
Mozina Jerome
Purchase Details
Closed on
Nov 22, 1988
Create a Home Valuation Report for This Property
The Home Valuation Report is an in-depth analysis detailing your home's value as well as a comparison with similar homes in the area
Home Values in the Area
Average Home Value in this Area
Purchase History
| Date | Buyer | Sale Price | Title Company |
|---|---|---|---|
| The Robert & Colleen Pescatore Family Tr | -- | None Available | |
| Pescatore Robert A | -- | None Available | |
| Pescatore Robert A | $654,000 | Fidelity National Title Co | |
| Mozina Jerome | -- | -- | |
| -- | $280,000 | -- |
Source: Public Records
Mortgage History
| Date | Status | Borrower | Loan Amount |
|---|---|---|---|
| Open | Pescatore Robert A | $588,800 |
Source: Public Records
Tax History Compared to Growth
Tax History
| Year | Tax Paid | Tax Assessment Tax Assessment Total Assessment is a certain percentage of the fair market value that is determined by local assessors to be the total taxable value of land and additions on the property. | Land | Improvement |
|---|---|---|---|---|
| 2025 | $9,804 | $888,620 | $628,023 | $260,597 |
| 2024 | $9,804 | $871,197 | $615,709 | $255,488 |
| 2023 | $9,597 | $854,116 | $603,637 | $250,479 |
| 2022 | $9,437 | $837,369 | $591,801 | $245,568 |
| 2021 | $9,314 | $820,951 | $580,198 | $240,753 |
| 2020 | $9,188 | $812,534 | $574,249 | $238,285 |
| 2019 | $8,949 | $796,603 | $562,990 | $233,613 |
| 2018 | $8,698 | $780,984 | $551,951 | $229,033 |
| 2017 | $8,466 | $765,672 | $541,129 | $224,543 |
| 2016 | $8,293 | $750,660 | $530,519 | $220,141 |
| 2015 | $8,170 | $739,386 | $522,551 | $216,835 |
| 2014 | $7,539 | $684,903 | $512,315 | $172,588 |
Source: Public Records
Map
Nearby Homes
- 14105 Durhullen Dr
- 14963 Huntington Gate Dr Unit 2
- 14645 High Valley Rd
- 0 N of Poway Road Lot 12 and 26 Unit PTP2508868
- 14224 Harrow Place
- 44 Carlson Ct
- 45 Carlson Ct
- 43 Carlson Ct
- 14265 Sandhill Rd
- 0 Pebble Canyon Dr Unit PTP2505722
- 13645 Paseo de la Huerta Unit 1
- 13765 Holly Oak Way
- 14033 Riverbend Rd
- 13770 Holly Oak Way
- 15176 Vali Hai Rd
- 13591 Summit Cir
- 15615 Boulder Ridge Ln
- 13570 Summit Cir
- 13760 Holly Oak Way
- 15260 Vali Hai Rd
- 14275 Hacienda Ln
- 14249 High Valley Rd
- 14260 Hacienda Ln
- 14284 Hacienda Ln
- 15159 Espola Rd
- 15131 Espola Rd
- 14270 Hacienda Ln
- 14301 High Valley Rd
- 14280 Hacienda Ln
- 15121 Espola Rd
- 14297 Hacienda Ln
- 14256 High Valley Rd
- 14292 Hacienda Ln
- 15157 Huntington Ct
- 15157 Huntington Ct
- 15157 Huntington Ct Unit 10915
- 15109 Espola Rd
- 15161 Huntington Ct
- 14316 High Valley Rd
- 14317 High Valley Rd