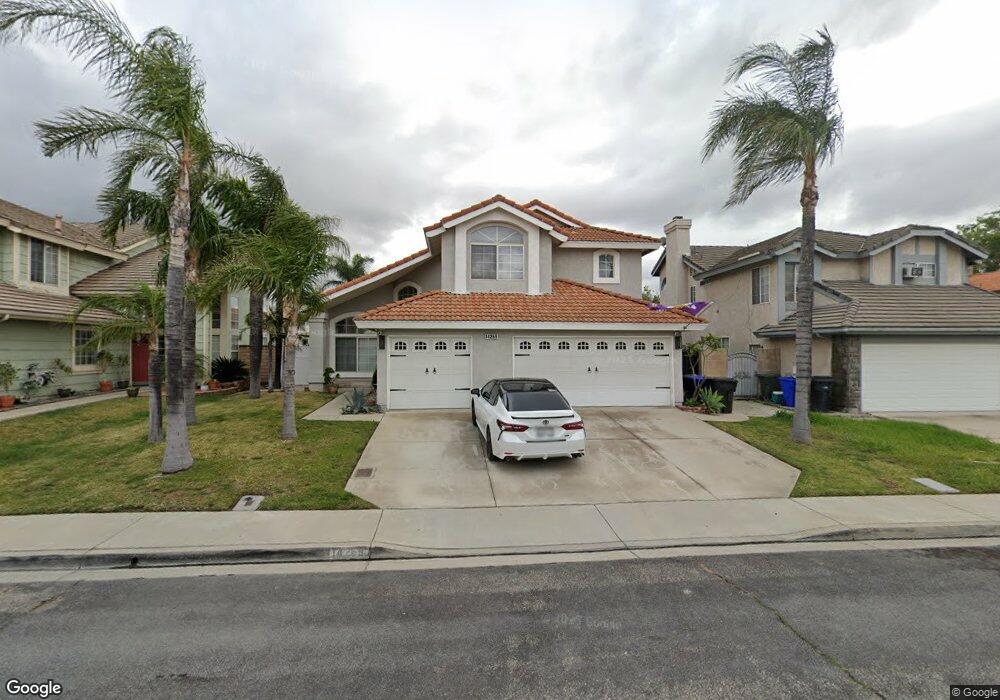
14265 Lauramore Ct Fontana, CA 92336
West End NeighborhoodEstimated Value: $785,000 - $827,242
4
Beds
3
Baths
2,425
Sq Ft
$329/Sq Ft
Est. Value
About This Home
This home is located at 14265 Lauramore Ct, Fontana, CA 92336 and is currently estimated at $798,811, approximately $329 per square foot. 14265 Lauramore Ct is a home located in San Bernardino County with nearby schools including East Heritage Elementary School, Heritage Intermediate School, and Etiwanda High.
Ownership History
Date
Name
Owned For
Owner Type
Purchase Details
Closed on
Dec 24, 2013
Sold by
Parra Flavio
Bought by
Parra Flavio and Orozco Nancy
Current Estimated Value
Home Financials for this Owner
Home Financials are based on the most recent Mortgage that was taken out on this home.
Original Mortgage
$309,974
Outstanding Balance
$232,686
Interest Rate
4.32%
Mortgage Type
New Conventional
Estimated Equity
$566,125
Purchase Details
Closed on
Aug 29, 2008
Sold by
Gracias Jose A
Bought by
Parra Flavio
Home Financials for this Owner
Home Financials are based on the most recent Mortgage that was taken out on this home.
Original Mortgage
$324,000
Interest Rate
5.77%
Mortgage Type
Purchase Money Mortgage
Purchase Details
Closed on
Feb 8, 1994
Sold by
Beazer Homes California Inc
Bought by
Gracias Jose A and Gracias Janeth V
Home Financials for this Owner
Home Financials are based on the most recent Mortgage that was taken out on this home.
Original Mortgage
$170,900
Interest Rate
7%
Create a Home Valuation Report for This Property
The Home Valuation Report is an in-depth analysis detailing your home's value as well as a comparison with similar homes in the area
Home Values in the Area
Average Home Value in this Area
Purchase History
| Date | Buyer | Sale Price | Title Company |
|---|---|---|---|
| Parra Flavio | -- | Advantage Title Inc | |
| Parra Flavio | $360,000 | Southland Title | |
| Gracias Jose A | $180,000 | Investors Title Company |
Source: Public Records
Mortgage History
| Date | Status | Borrower | Loan Amount |
|---|---|---|---|
| Open | Parra Flavio | $309,974 | |
| Previous Owner | Parra Flavio | $324,000 | |
| Previous Owner | Gracias Jose A | $170,900 |
Source: Public Records
Tax History Compared to Growth
Tax History
| Year | Tax Paid | Tax Assessment Tax Assessment Total Assessment is a certain percentage of the fair market value that is determined by local assessors to be the total taxable value of land and additions on the property. | Land | Improvement |
|---|---|---|---|---|
| 2025 | $6,320 | $463,598 | $115,899 | $347,699 |
| 2024 | $6,320 | $454,507 | $113,626 | $340,881 |
| 2023 | $6,164 | $445,595 | $111,398 | $334,197 |
| 2022 | $6,061 | $436,858 | $109,214 | $327,644 |
| 2021 | $5,944 | $428,293 | $107,073 | $321,220 |
| 2020 | $5,820 | $423,901 | $105,975 | $317,926 |
| 2019 | $5,670 | $415,589 | $103,897 | $311,692 |
| 2018 | $5,620 | $407,440 | $101,860 | $305,580 |
| 2017 | $5,359 | $399,451 | $99,863 | $299,588 |
| 2016 | $6,032 | $391,619 | $97,905 | $293,714 |
| 2015 | $5,953 | $385,736 | $96,434 | $289,302 |
| 2014 | $5,788 | $378,180 | $94,545 | $283,635 |
Source: Public Records
Map
Nearby Homes
- 14334 Quail Ct
- 7465 Doheny Ct
- 14084 Rothchild Ct
- 14028 Yorktown Ct
- 14219 Point Loma St
- 7245 Bodega St
- 13643 Cabrillo Ct
- 14093 Marbella St
- 7397 Mcclellan Ct
- 8043 Tuscany St
- 7543 W Liberty Pkwy Unit 711
- 13414 Columbus Ct
- 14610 Idaho St
- 7044 Mallow Dr Unit 4
- 14418 Bing Ave
- 14412 Bing Ave
- 14408 Bing Ave
- 14424 Bing Ave
- 14428 Bing Ave
- 14432 Bing Ave
- 14271 Lauramore Ct
- 14255 Lauramore Ct
- 14249 Lauramore Ct
- 14276 Caryn Cir
- 14281 Lauramore Ct
- 14268 Caryn Cir
- 14256 Larkin Ct
- 14284 Caryn Cir
- 14254 Lauramore Ct
- 14264 Lauramore Ct
- 14239 Lauramore Ct
- 14248 Lauramore Ct
- 14274 Lauramore Ct
- 14291 Lauramore Ct
- 14262 Caryn Cir
- 14296 Caryn Cir
- 14246 Larkin Ct
- 14242 Lauramore Ct
- 14233 Lauramore Ct
- 14286 Lauramore Ct