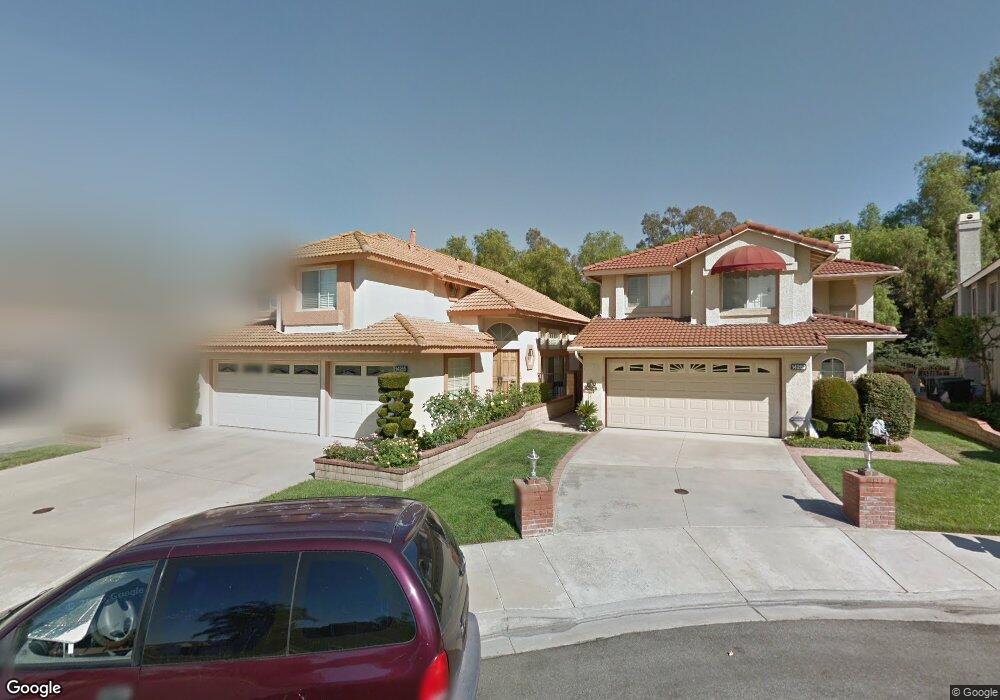
14265 Parkside Ct Chino Hills, CA 91709
North Chino Hills NeighborhoodEstimated Value: $1,038,026 - $1,162,000
4
Beds
3
Baths
1,996
Sq Ft
$564/Sq Ft
Est. Value
About This Home
This home is located at 14265 Parkside Ct, Chino Hills, CA 91709 and is currently estimated at $1,125,757, approximately $564 per square foot. 14265 Parkside Ct is a home located in San Bernardino County with nearby schools including Country Springs Elementary School, Canyon Hills Junior High School, and Ruben S. Ayala High School.
Ownership History
Date
Name
Owned For
Owner Type
Purchase Details
Closed on
Sep 25, 2024
Sold by
Sacoy Heidi and Sacoy Clare Heidi
Bought by
Sacoy Revocable Living Trust and Sacoy
Current Estimated Value
Purchase Details
Closed on
Oct 15, 2007
Sold by
Sacoy Glenn Rex and Sacoy Clare
Bought by
Sacoy Glenn Rex and Sacoy Clare Heidi
Home Financials for this Owner
Home Financials are based on the most recent Mortgage that was taken out on this home.
Original Mortgage
$10,000
Interest Rate
6.27%
Mortgage Type
Credit Line Revolving
Purchase Details
Closed on
Sep 9, 1997
Sold by
Vasquez Gregorio and Vasquez Bonnie S
Bought by
Sacoy Glenn Rex and Sacoy Clare
Home Financials for this Owner
Home Financials are based on the most recent Mortgage that was taken out on this home.
Original Mortgage
$164,500
Interest Rate
7.49%
Create a Home Valuation Report for This Property
The Home Valuation Report is an in-depth analysis detailing your home's value as well as a comparison with similar homes in the area
Home Values in the Area
Average Home Value in this Area
Purchase History
| Date | Buyer | Sale Price | Title Company |
|---|---|---|---|
| Sacoy Revocable Living Trust | -- | None Listed On Document | |
| Sacoy Glenn Rex | -- | Lawyers Title Co | |
| Sacoy Glenn Rex | $224,500 | First American Title Ins Co |
Source: Public Records
Mortgage History
| Date | Status | Borrower | Loan Amount |
|---|---|---|---|
| Previous Owner | Sacoy Glenn Rex | $10,000 | |
| Previous Owner | Sacoy Glenn Rex | $164,500 |
Source: Public Records
Tax History Compared to Growth
Tax History
| Year | Tax Paid | Tax Assessment Tax Assessment Total Assessment is a certain percentage of the fair market value that is determined by local assessors to be the total taxable value of land and additions on the property. | Land | Improvement |
|---|---|---|---|---|
| 2025 | $4,324 | $358,467 | $89,578 | $268,889 |
| 2024 | $4,324 | $351,439 | $87,822 | $263,617 |
| 2023 | $4,217 | $344,548 | $86,100 | $258,448 |
| 2022 | $4,193 | $337,792 | $84,412 | $253,380 |
| 2021 | $4,120 | $331,169 | $82,757 | $248,412 |
| 2020 | $4,072 | $327,773 | $81,908 | $245,865 |
| 2019 | $4,009 | $321,346 | $80,302 | $241,044 |
| 2018 | $3,930 | $315,045 | $78,727 | $236,318 |
| 2017 | $3,867 | $308,867 | $77,183 | $231,684 |
| 2016 | $3,646 | $302,811 | $75,670 | $227,141 |
| 2015 | $3,582 | $298,262 | $74,533 | $223,729 |
| 2014 | $4,074 | $292,419 | $73,073 | $219,346 |
Source: Public Records
Map
Nearby Homes
- 2286 Black Pine Rd
- 2460 Windmill Creek Rd
- 14171 Shoreline Dr
- 14726 Moon Crest Ln Unit E
- 14748 Moon Crest Ln Unit E
- 14155 Applegate Ln
- 2432 Moon Dust Dr Unit B
- 2515 Pointe Coupee
- 2509 Moon Dust Dr Unit A
- 1839 Nordic Ave
- 13663 Monteverde Dr
- 15075 Avenida Del Monte
- 2024 Vista Del Sol
- 3056 Giant Forest Loop
- 15036 Calle la Paloma
- 13470 Palamos Place
- 15085 Calle Verano
- 13530 Tawny Ln
- 3159 Morningfield Dr
- 3167 Morningfield Dr
- 14261 Parkside Ct
- 14269 Parkside Ct
- 14259 Parkside Ct
- 14271 Parkside Ct
- 14255 Parkside Ct
- 14275 Parkside Ct
- 14251 Parkside Ct
- 14256 Parkside Ct
- 14279 Parkside Ct
- 14266 Parkside Ct
- 14247 Parkside Ct
- 14274 Parkside Ct
- 2356 Brookhaven Dr
- 14248 Parkside Ct
- 14270 Parkside Ct
- 2359 Spring Meadow Dr
- 14243 Parkside Ct
- 14244 Parkside Ct
- 14249 Village Park Place
- 2357 Brookhaven Dr