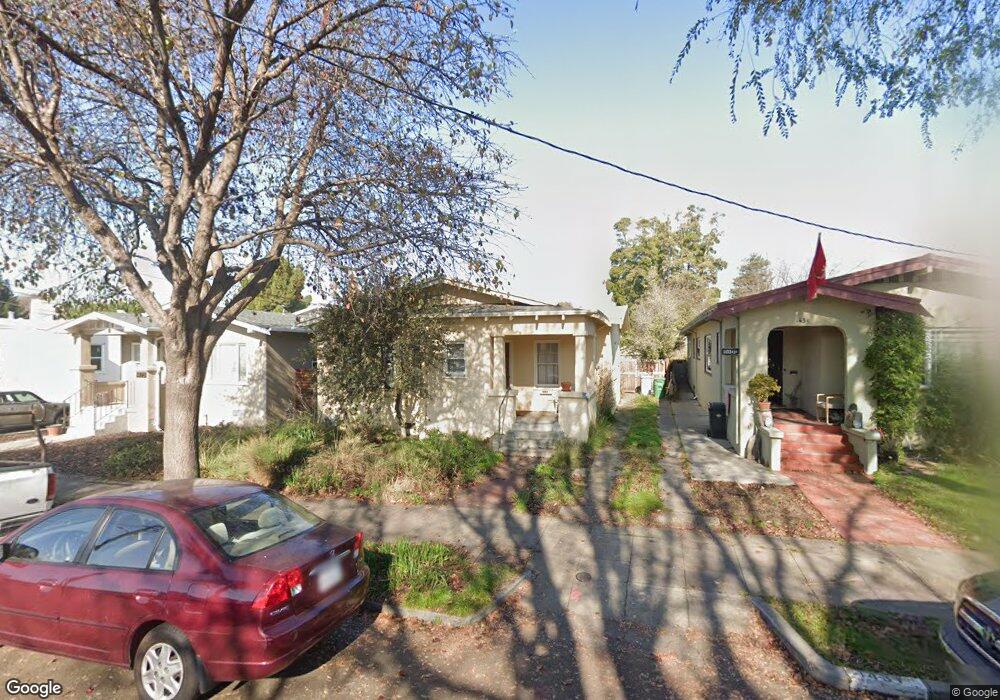
1427 Derby St Berkeley, CA 94702
West Berkeley NeighborhoodEstimated Value: $898,000 - $1,343,037
3
Beds
1
Bath
1,402
Sq Ft
$822/Sq Ft
Est. Value
About This Home
This home is located at 1427 Derby St, Berkeley, CA 94702 and is currently estimated at $1,152,009, approximately $821 per square foot. 1427 Derby St is a home located in Alameda County with nearby schools including Malcolm X Elementary School, Washington Elementary School, and Oxford Elementary School.
Ownership History
Date
Name
Owned For
Owner Type
Purchase Details
Closed on
Oct 12, 2022
Sold by
Thornton Carol E
Bought by
Thornton Living Trust
Current Estimated Value
Purchase Details
Closed on
Sep 20, 1994
Sold by
Manuel Eleanor M and Temple Yvonne A
Bought by
Thornton Carol E
Home Financials for this Owner
Home Financials are based on the most recent Mortgage that was taken out on this home.
Original Mortgage
$160,550
Interest Rate
4.87%
Create a Home Valuation Report for This Property
The Home Valuation Report is an in-depth analysis detailing your home's value as well as a comparison with similar homes in the area
Home Values in the Area
Average Home Value in this Area
Purchase History
| Date | Buyer | Sale Price | Title Company |
|---|---|---|---|
| Thornton Living Trust | -- | -- | |
| Thornton Carol E | $169,000 | Old Republic Title Company |
Source: Public Records
Mortgage History
| Date | Status | Borrower | Loan Amount |
|---|---|---|---|
| Previous Owner | Thornton Carol E | $160,550 |
Source: Public Records
Tax History Compared to Growth
Tax History
| Year | Tax Paid | Tax Assessment Tax Assessment Total Assessment is a certain percentage of the fair market value that is determined by local assessors to be the total taxable value of land and additions on the property. | Land | Improvement |
|---|---|---|---|---|
| 2025 | $6,501 | $276,853 | $85,156 | $198,697 |
| 2024 | $6,501 | $271,288 | $83,486 | $194,802 |
| 2023 | $6,280 | $265,833 | $81,850 | $190,983 |
| 2022 | $6,111 | $260,484 | $80,245 | $187,239 |
| 2021 | $5,924 | $255,240 | $78,672 | $183,568 |
| 2020 | $5,529 | $259,551 | $77,865 | $181,686 |
| 2019 | $5,220 | $254,462 | $76,338 | $178,124 |
| 2018 | $5,100 | $249,474 | $74,842 | $174,632 |
| 2017 | $4,894 | $244,583 | $73,375 | $171,208 |
| 2016 | $4,665 | $239,788 | $71,936 | $167,852 |
| 2015 | $4,587 | $236,187 | $70,856 | $165,331 |
| 2014 | $4,474 | $231,561 | $69,468 | $162,093 |
Source: Public Records
Map
Nearby Homes
- 2750 Sacramento St
- 1450 Ward St
- 2758 Sacramento St
- 2728 Dohr St
- 2774 Sacramento St
- 1516 Blake St
- 1516 Blake St Unit A
- 2782 Sacramento St
- 1524 Blake St
- 2790 Sacramento St
- 1606 Derby St
- 1612 Parker St
- 1431 Dwight Way
- 1540 Stuart St
- 2437 Acton St
- 2829 California St
- 2703 Mathews St
- 1711 Carleton St
- 2435 Bonar St
- 1726 Parker St Unit 2
- 1423 Derby St
- 1431 Derby St
- 1435 Derby St
- 1419 Derby St
- 1422 Carleton St
- 1439 Derby St
- 1428 Carleton St
- 1416 Carleton St
- 1400 Carleton St
- 1408 Carleton St
- 1432 Carleton St
- 1443 Derby St
- 1416 Derby St
- 1436 Carleton St
- 1422 Derby St
- 1420 Derby St
- 1424 Derby St
- 1404 Carleton St
- 1428 Derby St
- 1432 Derby St