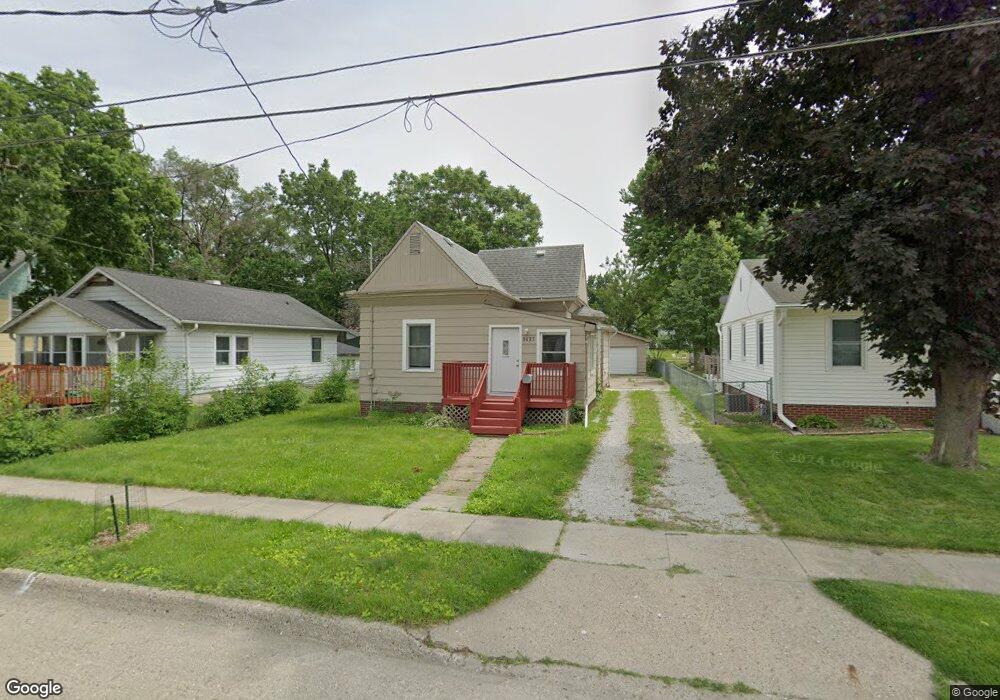
1427 E Tiffin Ave Des Moines, IA 50316
Highland Park NeighborhoodEstimated Value: $117,000 - $151,000
1
Bed
1
Bath
822
Sq Ft
$166/Sq Ft
Est. Value
About This Home
This home is located at 1427 E Tiffin Ave, Des Moines, IA 50316 and is currently estimated at $136,667, approximately $166 per square foot. 1427 E Tiffin Ave is a home located in Polk County with nearby schools including Cattell Elementary School, Goodrell Middle School, and North High School.
Ownership History
Date
Name
Owned For
Owner Type
Purchase Details
Closed on
Apr 24, 2020
Sold by
County Of Polk
Bought by
Cam Fund 2020 Llc
Current Estimated Value
Home Financials for this Owner
Home Financials are based on the most recent Mortgage that was taken out on this home.
Original Mortgage
$77,000
Outstanding Balance
$68,083
Interest Rate
3.3%
Mortgage Type
Construction
Estimated Equity
$68,584
Purchase Details
Closed on
Jun 2, 2004
Sold by
Goodwin Richard J and Goodwin Sheila A
Bought by
Ogden Jimmie D
Home Financials for this Owner
Home Financials are based on the most recent Mortgage that was taken out on this home.
Original Mortgage
$68,450
Interest Rate
6.06%
Mortgage Type
VA
Purchase Details
Closed on
Jul 1, 1998
Sold by
Ross Russell
Bought by
Goodwin Richard J and Barnes Sheila A
Home Financials for this Owner
Home Financials are based on the most recent Mortgage that was taken out on this home.
Original Mortgage
$37,650
Interest Rate
7.07%
Create a Home Valuation Report for This Property
The Home Valuation Report is an in-depth analysis detailing your home's value as well as a comparison with similar homes in the area
Home Values in the Area
Average Home Value in this Area
Purchase History
| Date | Buyer | Sale Price | Title Company |
|---|---|---|---|
| Cam Fund 2020 Llc | $74,000 | None Available | |
| Ogden Jimmie D | $66,500 | -- | |
| Goodwin Richard J | $37,500 | -- |
Source: Public Records
Mortgage History
| Date | Status | Borrower | Loan Amount |
|---|---|---|---|
| Open | Cam Fund 2020 Llc | $77,000 | |
| Previous Owner | Ogden Jimmie D | $68,450 | |
| Previous Owner | Goodwin Richard J | $37,650 |
Source: Public Records
Tax History Compared to Growth
Tax History
| Year | Tax Paid | Tax Assessment Tax Assessment Total Assessment is a certain percentage of the fair market value that is determined by local assessors to be the total taxable value of land and additions on the property. | Land | Improvement |
|---|---|---|---|---|
| 2024 | $2,216 | $112,600 | $23,800 | $88,800 |
| 2023 | $2,114 | $112,600 | $23,800 | $88,800 |
| 2022 | $1,730 | $89,700 | $19,900 | $69,800 |
| 2021 | $1,946 | $74,000 | $19,900 | $54,100 |
| 2020 | $2,292 | $78,000 | $17,400 | $60,600 |
| 2019 | $2,252 | $88,400 | $17,400 | $71,000 |
| 2018 | $2,230 | $83,800 | $16,200 | $67,600 |
| 2017 | $2,064 | $83,800 | $16,200 | $67,600 |
| 2016 | $2,010 | $76,300 | $14,700 | $61,600 |
| 2015 | $2,010 | $76,300 | $14,700 | $61,600 |
| 2014 | $2,004 | $78,300 | $14,800 | $63,500 |
Source: Public Records
Map
Nearby Homes
- 1424 Richmond Ave
- 1428 E Tiffin Ave
- 1422 Hull Ave
- 1520 E Tiffin Ave
- 2706 E 16th St
- 1332 E Sheridan Ave
- 1432 Royer St
- 3215 E 8th St
- 1109 E Sheridan Ave
- 816 Boyd St
- 3007 E 8th St
- 3315 E 8th St
- 903 Morton Ave
- 1424 Milton Ave
- 2517 Sampson St
- 3623 Wright St
- 2529 Glenbrook Dr
- 3723 Wright St
- 3704 Wright St
- 3210 E 7th St
- 1429 E Tiffin Ave
- 1425 E Tiffin Ave
- 1419 E Tiffin Ave
- 1433 E Tiffin Ave
- 1437 E Tiffin Ave
- 1417 E Tiffin Ave
- 1428 Richmond Ave
- 1432 Richmond Ave
- 1420 Richmond Ave
- 1436 Richmond Ave
- 1441 E Tiffin Ave
- 1430 E Tiffin Ave
- 1415 E Tiffin Ave
- 1424 E Tiffin Ave
- 1440 Richmond Ave
- 1418 Richmond Ave
- 1420 E Tiffin Ave
- 1438 E Tiffin Ave
- 1444 Richmond Ave
- 1411 E Tiffin Ave