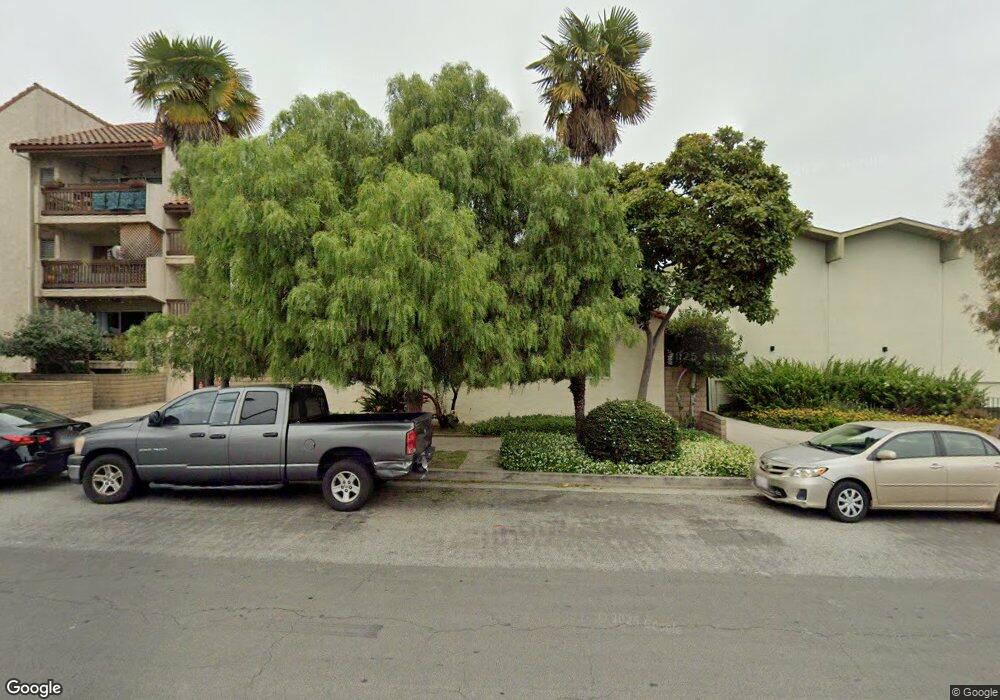
1427 Euclid St Unit 6 Santa Monica, CA 90404
Pico NeighborhoodEstimated Value: $2,186,000 - $2,267,893
8
Beds
6
Baths
3,462
Sq Ft
$643/Sq Ft
Est. Value
About This Home
This home is located at 1427 Euclid St Unit 6, Santa Monica, CA 90404 and is currently estimated at $2,226,947, approximately $643 per square foot. 1427 Euclid St Unit 6 is a home located in Los Angeles County with nearby schools including McKinley Elementary School, Lincoln Middle School, and Santa Monica High School.
Ownership History
Date
Name
Owned For
Owner Type
Purchase Details
Closed on
Mar 6, 2024
Sold by
Roger And Evelyn Later Family Trust
Bought by
Tyh Fund Llc
Current Estimated Value
Home Financials for this Owner
Home Financials are based on the most recent Mortgage that was taken out on this home.
Original Mortgage
$1,075,000
Outstanding Balance
$1,057,120
Interest Rate
6.63%
Mortgage Type
New Conventional
Estimated Equity
$1,169,827
Purchase Details
Closed on
Jan 11, 2017
Sold by
Later Later Evelyn C Evelyn C and Later Moore Angela
Bought by
Later Later Evelyn C Evelyn C and Later Moore Angela
Purchase Details
Closed on
Feb 15, 2016
Sold by
Later Evelyn C and The Roger & Evelyn Later Famil
Bought by
The Roger & Evelyn Later Family Trust
Purchase Details
Closed on
Jul 19, 2013
Sold by
Later Roger D and Later Evelyn Carson
Bought by
Later Roger D and Later Evelyn C
Create a Home Valuation Report for This Property
The Home Valuation Report is an in-depth analysis detailing your home's value as well as a comparison with similar homes in the area
Home Values in the Area
Average Home Value in this Area
Purchase History
| Date | Buyer | Sale Price | Title Company |
|---|---|---|---|
| Tyh Fund Llc | $2,220,000 | Old Republic Title Company | |
| Tyh Fund Llc | $2,220,000 | Old Republic Title Company | |
| Later Later Evelyn C Evelyn C | -- | None Available | |
| The Roger & Evelyn Later Family Trust | -- | None Available | |
| Later Roger D | -- | None Available |
Source: Public Records
Mortgage History
| Date | Status | Borrower | Loan Amount |
|---|---|---|---|
| Open | Tyh Fund Llc | $1,075,000 | |
| Closed | Tyh Fund Llc | $1,075,000 |
Source: Public Records
Tax History Compared to Growth
Tax History
| Year | Tax Paid | Tax Assessment Tax Assessment Total Assessment is a certain percentage of the fair market value that is determined by local assessors to be the total taxable value of land and additions on the property. | Land | Improvement |
|---|---|---|---|---|
| 2025 | $3,425 | $2,264,400 | $1,989,000 | $275,400 |
| 2024 | $3,425 | $151,359 | $103,800 | $47,559 |
| 2023 | $3,375 | $148,392 | $101,765 | $46,627 |
| 2022 | $3,315 | $145,483 | $99,770 | $45,713 |
| 2021 | $3,196 | $142,631 | $97,814 | $44,817 |
| 2019 | $3,134 | $138,403 | $94,914 | $43,489 |
| 2018 | $2,925 | $135,690 | $93,053 | $42,637 |
| 2016 | $2,737 | $130,423 | $89,441 | $40,982 |
| 2015 | $2,701 | $128,465 | $88,098 | $40,367 |
| 2014 | $2,725 | $125,950 | $86,373 | $39,577 |
Source: Public Records
Map
Nearby Homes
- 1433 14th St Unit 10
- 1433 14th St Unit 1
- 1507 14th St
- 1428 12th St
- 1531 12th St Unit 1
- 1333 14th St Unit 8
- 1547 Euclid St
- 1544 12th St Unit 303
- 1216 1/2 Arizona Ave
- 1307 15th St
- 1244 14th St Unit C
- 1244 14th St Unit E
- 1228 14th St Unit 103
- 1228 14th St Unit 104
- 1228 14th St Unit 201
- 1234 12th St Unit 5
- 1301 17th St Unit 102
- 1301 17th St Unit 105
- 1239 9th St Unit 4
- 1131 12th St Unit 101
- 1427 Euclid St
- 1433 Euclid St
- 1437 Euclid St
- 1417 Euclid St Unit 2
- 1417 Euclid St
- 1438 Euclid St
- 1424-1428 14th St
- 1434 14th St
- 1424 14th St Unit 3
- 1424 14th St
- 1438 14th St
- 1453 Euclid St
- 1418 14th St
- 1311 Broadway
- 1453 12th St Unit 2
- 1453 12th St Unit 5
- 1453 12th St
- 1453 12th St Unit 3
- 1433 14th St Unit 2
- 1433 14th St Unit 15