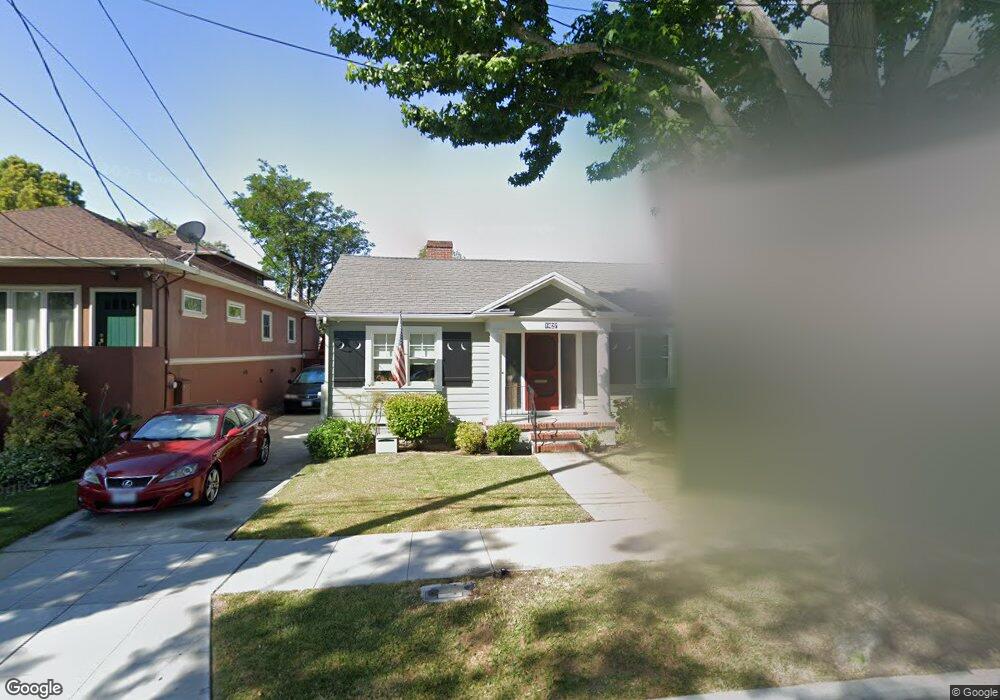
1427 Laguna Ave Burlingame, CA 94010
Burlingame Grove NeighborhoodEstimated Value: $2,116,000 - $2,885,000
4
Beds
2
Baths
1,860
Sq Ft
$1,428/Sq Ft
Est. Value
About This Home
This home is located at 1427 Laguna Ave, Burlingame, CA 94010 and is currently estimated at $2,656,415, approximately $1,428 per square foot. 1427 Laguna Ave is a home located in San Mateo County with nearby schools including Lincoln Elementary School, Burlingame Intermediate School, and Burlingame High School.
Ownership History
Date
Name
Owned For
Owner Type
Purchase Details
Closed on
Jul 23, 2005
Sold by
Rundle William and Rundle Amy Chen
Bought by
Rundle William R and Rundle Amy Chen
Current Estimated Value
Purchase Details
Closed on
Oct 9, 2001
Sold by
Butler Neil Thomas and Butler Lorelle M
Bought by
Rundle William and Rundle Amy Chen
Home Financials for this Owner
Home Financials are based on the most recent Mortgage that was taken out on this home.
Original Mortgage
$515,000
Outstanding Balance
$199,232
Interest Rate
6.73%
Estimated Equity
$2,457,183
Purchase Details
Closed on
Jan 21, 1998
Sold by
Spence Jeanette M and Dee Spence Diana
Bought by
Butler Neil Thomas and Butler Lorelle M
Home Financials for this Owner
Home Financials are based on the most recent Mortgage that was taken out on this home.
Original Mortgage
$340,000
Interest Rate
7.05%
Create a Home Valuation Report for This Property
The Home Valuation Report is an in-depth analysis detailing your home's value as well as a comparison with similar homes in the area
Home Values in the Area
Average Home Value in this Area
Purchase History
| Date | Buyer | Sale Price | Title Company |
|---|---|---|---|
| Rundle William R | -- | -- | |
| Rundle William | $765,000 | First American Title Co | |
| Butler Neil Thomas | $425,000 | Old Republic Title Ins Compa |
Source: Public Records
Mortgage History
| Date | Status | Borrower | Loan Amount |
|---|---|---|---|
| Open | Rundle William | $515,000 | |
| Previous Owner | Butler Neil Thomas | $340,000 |
Source: Public Records
Tax History Compared to Growth
Tax History
| Year | Tax Paid | Tax Assessment Tax Assessment Total Assessment is a certain percentage of the fair market value that is determined by local assessors to be the total taxable value of land and additions on the property. | Land | Improvement |
|---|---|---|---|---|
| 2025 | $12,775 | $1,130,116 | $565,058 | $565,058 |
| 2023 | $12,775 | $1,086,234 | $543,117 | $543,117 |
| 2022 | $12,321 | $1,064,936 | $532,468 | $532,468 |
| 2021 | $12,335 | $1,044,056 | $522,028 | $522,028 |
| 2020 | $12,080 | $1,033,352 | $516,676 | $516,676 |
| 2019 | $11,815 | $1,013,092 | $506,546 | $506,546 |
| 2018 | $11,590 | $993,228 | $496,614 | $496,614 |
| 2017 | $12,139 | $973,754 | $486,877 | $486,877 |
| 2016 | $11,081 | $954,662 | $477,331 | $477,331 |
| 2015 | $11,031 | $940,324 | $470,162 | $470,162 |
| 2014 | $10,870 | $921,906 | $460,953 | $460,953 |
Source: Public Records
Map
Nearby Homes
- 1431 Laguna Ave
- 1325 Paloma Ave
- 1300 Paloma Ave
- 1421 El Camino Real Unit 6
- 1237 Capuchino Ave Unit 7
- 1217 Paloma Ave Unit 3
- 1500 Broadway Unit 205
- 1137 Paloma Ave Unit E
- 1111 Laguna Ave
- 1115 Capuchino Ave
- 1315 Carmelita Ave
- 1044 Paloma Ave
- 2301 Easton Dr
- 1568 Columbus Ave
- 8 Reynolds Ct
- 1735 Crockett Ln
- 1425 Castillo Ave
- 900 Toyon Dr
- 824 El Camino Real
- 1030 Morrell Ave
- 1423 Laguna Ave
- 1421 Laguna Ave
- 1437 Laguna Ave
- 1426 Paloma Ave
- 1430 Paloma Ave
- 1422 Paloma Ave
- 1415 Laguna Ave
- 1441 Laguna Ave
- 1434 Paloma Ave
- 1418 Paloma Ave
- 1428 Laguna Ave
- 1424 Laguna Ave
- 1432 Laguna Ave
- 1438 Paloma Ave
- 1414 Paloma Ave
- 1411 Laguna Ave
- 1443 Laguna Ave
- 1438 Laguna Ave
- 1442 Paloma Ave
- 1410 Paloma Ave