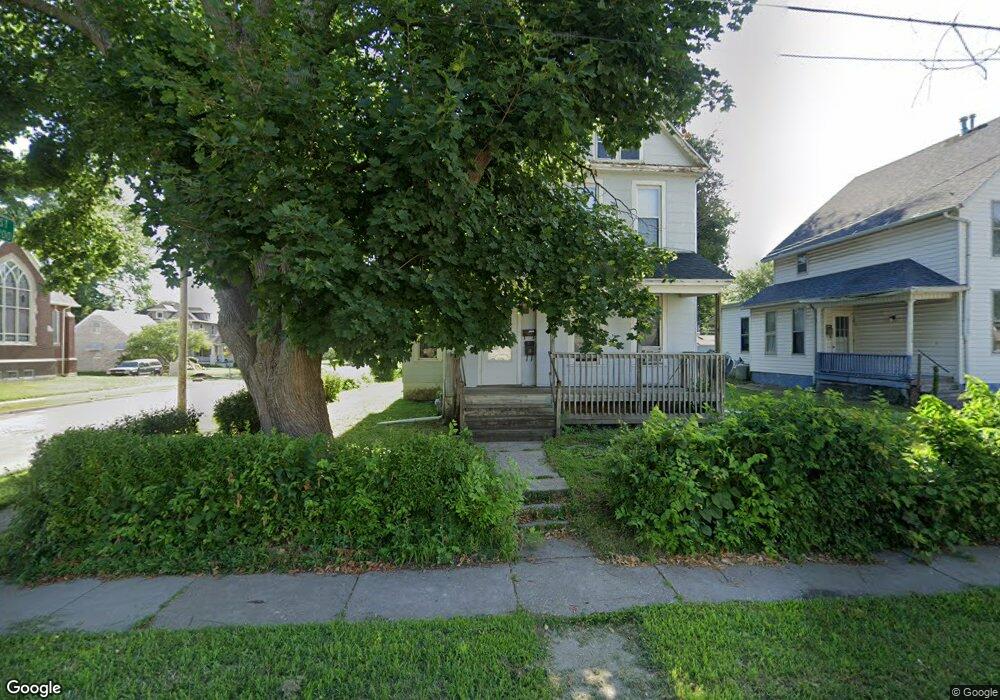
1427 N Marquette St Davenport, IA 52804
Central Davenport NeighborhoodEstimated Value: $95,000 - $146,000
2
Beds
2
Baths
2,102
Sq Ft
$53/Sq Ft
Est. Value
About This Home
This home is located at 1427 N Marquette St, Davenport, IA 52804 and is currently estimated at $111,190, approximately $52 per square foot. 1427 N Marquette St is a home located in Scott County with nearby schools including Christian County Day Treatment Center Alt, Christian County Middle School, and Casey County Middle School.
Ownership History
Date
Name
Owned For
Owner Type
Purchase Details
Closed on
Aug 28, 2020
Sold by
Burrage Kendrick and Burrage Melissa
Bought by
Burrage Estates Llc
Current Estimated Value
Purchase Details
Closed on
Apr 27, 2020
Sold by
Ksb Series Llc
Bought by
Barrage Kendrick and Burrage Melissa
Home Financials for this Owner
Home Financials are based on the most recent Mortgage that was taken out on this home.
Original Mortgage
$48,750
Outstanding Balance
$43,348
Interest Rate
3.6%
Mortgage Type
New Conventional
Estimated Equity
$67,842
Purchase Details
Closed on
Sep 10, 2014
Sold by
Broders Scott and Broders Anna
Bought by
Broders Kevin B
Purchase Details
Closed on
Feb 19, 2014
Sold by
Broders Kevin B and Broders Mary M
Bought by
Ksb Series Llc
Purchase Details
Closed on
Feb 4, 2014
Sold by
Newburn Jeffrey and Newburn Sharon
Bought by
Broders Kevin B
Create a Home Valuation Report for This Property
The Home Valuation Report is an in-depth analysis detailing your home's value as well as a comparison with similar homes in the area
Home Values in the Area
Average Home Value in this Area
Purchase History
| Date | Buyer | Sale Price | Title Company |
|---|---|---|---|
| Burrage Estates Llc | -- | None Available | |
| Barrage Kendrick | $65,000 | None Available | |
| Broders Kevin B | -- | None Available | |
| Ksb Series Llc | -- | None Available | |
| Broders Kevin B | $48,000 | None Available |
Source: Public Records
Mortgage History
| Date | Status | Borrower | Loan Amount |
|---|---|---|---|
| Open | Barrage Kendrick | $48,750 |
Source: Public Records
Tax History Compared to Growth
Tax History
| Year | Tax Paid | Tax Assessment Tax Assessment Total Assessment is a certain percentage of the fair market value that is determined by local assessors to be the total taxable value of land and additions on the property. | Land | Improvement |
|---|---|---|---|---|
| 2025 | $1,494 | $86,890 | $16,900 | $69,990 |
| 2024 | $4,280 | $83,550 | $16,900 | $66,650 |
| 2023 | $4,152 | $83,550 | $16,900 | $66,650 |
| 2022 | $1,662 | $71,020 | $8,320 | $62,700 |
| 2021 | $1,384 | $64,490 | $8,320 | $56,170 |
| 2020 | $1,208 | $55,580 | $8,320 | $47,260 |
| 2019 | $1,192 | $53,100 | $8,320 | $44,780 |
| 2018 | $1,166 | $53,100 | $8,320 | $44,780 |
| 2017 | $1,208 | $53,100 | $8,320 | $44,780 |
| 2016 | $1,162 | $53,100 | $0 | $0 |
| 2015 | $1,162 | $50,100 | $0 | $0 |
| 2014 | $1,112 | $50,100 | $0 | $0 |
| 2013 | $1,094 | $0 | $0 | $0 |
| 2012 | -- | $63,010 | $10,520 | $52,490 |
Source: Public Records
Map
Nearby Homes
- 1514 N Marquette St
- 1118 W 15th St
- 1034 W 14th St
- 1321 W 13th St
- 930 W 14th St
- 1335 W 13th St
- 1207 N Marquette St
- 1203 W Locust St
- 4735 W 12th St
- 1319 Warren St
- 822 W 14th St
- 1921 Lillie Ave
- 1505 W 14th St
- 1925 Vine St
- 734 W 17th St
- 2026 N Marquette St
- 1446 Clay St
- 2038 N Myrtle St
- 1309 Clay St
- 903 Vine St
- 1427 N Marquette St Unit 2
- 1421 N Marquette St
- 1419 N Marquette St
- 1209 W 15th St
- 1413 N Marquette St
- 1207 W 15th St
- 1502 N Marquette St
- 1428 N Marquette St
- 1212 W 15th St
- 1409 N Marquette St
- 1515 N Marquette St
- 1426 N Marquette St
- 1206 W 15th St
- 1131 W 15th St
- 1210 W 14th St
- 1312 W 15th St
- 1309 W 15th St
- 1518 N Marquette St
- 1220 W 14th St
- 1206 W 14th St