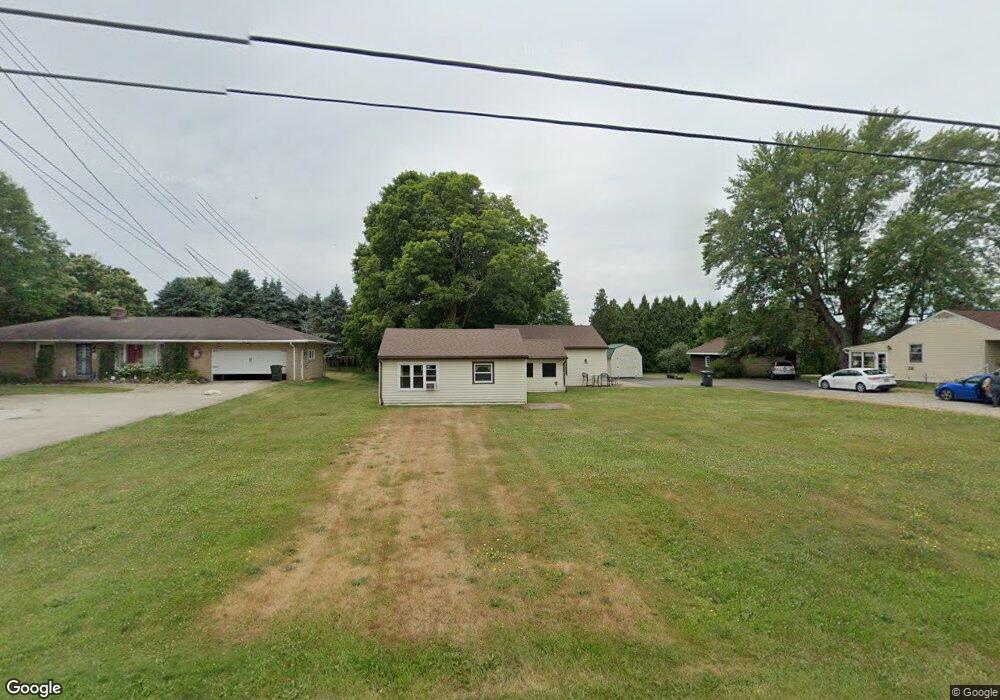
14275 Ravenna Ave NE Alliance, OH 44601
Estimated Value: $135,000 - $228,000
2
Beds
1
Bath
1,234
Sq Ft
$155/Sq Ft
Est. Value
About This Home
This home is located at 14275 Ravenna Ave NE, Alliance, OH 44601 and is currently estimated at $191,396, approximately $155 per square foot. 14275 Ravenna Ave NE is a home located in Stark County with nearby schools including Marlington High School.
Ownership History
Date
Name
Owned For
Owner Type
Purchase Details
Closed on
Feb 4, 2009
Sold by
Secretary Of Veterans Affairs
Bought by
Fildes Rebecca
Current Estimated Value
Purchase Details
Closed on
Jun 20, 2008
Sold by
Stewart Kevin S
Bought by
Va
Purchase Details
Closed on
Apr 9, 2003
Sold by
Cassetty Michelle L
Bought by
Stewart Kevin S
Home Financials for this Owner
Home Financials are based on the most recent Mortgage that was taken out on this home.
Original Mortgage
$105,400
Interest Rate
5.87%
Mortgage Type
VA
Purchase Details
Closed on
Nov 7, 2000
Sold by
Hall Jason G
Bought by
Cassetty Michelle L
Home Financials for this Owner
Home Financials are based on the most recent Mortgage that was taken out on this home.
Original Mortgage
$76,000
Interest Rate
7.91%
Mortgage Type
Purchase Money Mortgage
Purchase Details
Closed on
Jul 17, 1991
Create a Home Valuation Report for This Property
The Home Valuation Report is an in-depth analysis detailing your home's value as well as a comparison with similar homes in the area
Home Values in the Area
Average Home Value in this Area
Purchase History
| Date | Buyer | Sale Price | Title Company |
|---|---|---|---|
| Fildes Rebecca | -- | Accutitle Agency Inc | |
| Va | $66,000 | None Available | |
| Stewart Kevin S | $103,400 | -- | |
| Cassetty Michelle L | $86,000 | Union Title Company | |
| -- | $40,000 | -- |
Source: Public Records
Mortgage History
| Date | Status | Borrower | Loan Amount |
|---|---|---|---|
| Previous Owner | Stewart Kevin S | $105,400 | |
| Previous Owner | Cassetty Michelle L | $76,000 |
Source: Public Records
Tax History Compared to Growth
Tax History
| Year | Tax Paid | Tax Assessment Tax Assessment Total Assessment is a certain percentage of the fair market value that is determined by local assessors to be the total taxable value of land and additions on the property. | Land | Improvement |
|---|---|---|---|---|
| 2025 | -- | $48,650 | $17,360 | $31,290 |
| 2024 | $796 | $48,650 | $17,360 | $31,290 |
| 2023 | $1,554 | $38,990 | $13,230 | $25,760 |
| 2022 | $1,515 | $38,990 | $13,230 | $25,760 |
| 2021 | $1,517 | $38,990 | $13,230 | $25,760 |
| 2020 | $1,422 | $33,360 | $11,100 | $22,260 |
| 2019 | $1,413 | $33,360 | $11,100 | $22,260 |
| 2018 | $1,352 | $33,360 | $11,100 | $22,260 |
| 2017 | $1,307 | $29,790 | $9,660 | $20,130 |
| 2016 | $1,309 | $29,790 | $9,660 | $20,130 |
| 2015 | $1,311 | $29,790 | $9,660 | $20,130 |
| 2014 | $1,235 | $25,940 | $8,400 | $17,540 |
| 2013 | $604 | $25,940 | $8,400 | $17,540 |
Source: Public Records
Map
Nearby Homes
- 7377 Pontius St NE
- 167 State Route 44
- 3952 Laubert Rd
- 0 Pontius St NE
- 8736 Lynn Park St NE
- 0 New Milford Rd Unit 5119787
- 4829 Laubert Rd
- 6180 Edison St NE
- 14265 Reeder Ave NE
- 12200 Marlboro Ave NE
- 1026 Hartville Rd N
- 12561 Duquette Ave NE
- 1291 State Route 44
- 3990 Edison St NE
- 3705 Alexander Rd
- 5615 Laubert Rd
- 3381 Alexander Rd
- 14162 Congress Lake Ave NE
- 0 Shaffer Rd
- 3079 Alexander Rd
- 14251 Ravenna Ave NE
- 14295 Ravenna Ave NE
- 14270 Ravenna Ave NE
- 14280 Wade Ave NE
- 14246 Ravenna Ave NE
- 14300 Wade Ave NE
- 14341 Ravenna Ave NE
- 14222 Ravenna Ave NE
- 14244 Wade Ave NE
- 14198 Ravenna Ave NE
- 14236 Wade Ave NE
- 14175 Ravenna Ave NE
- 14371 Ravenna Ave NE
- 14281 Wade Ave NE
- 14180 Ravenna Ave NE
- 14263 Wade Dr NE
- 14301 Wade Ave NE
- 14263 Wade Ave NE
- 14237 Wade Ave NE
- 14170 Ravenna Ave NE