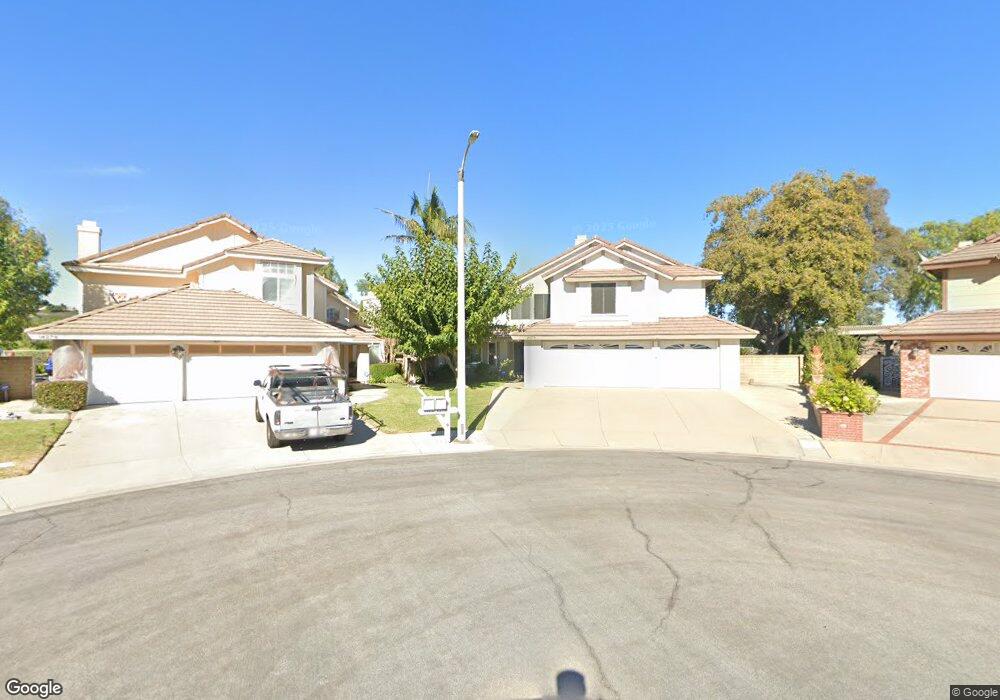
14279 Spring Crest Dr Chino Hills, CA 91709
North Chino Hills NeighborhoodEstimated Value: $1,424,000 - $1,526,000
5
Beds
3
Baths
3,185
Sq Ft
$458/Sq Ft
Est. Value
About This Home
This home is located at 14279 Spring Crest Dr, Chino Hills, CA 91709 and is currently estimated at $1,460,265, approximately $458 per square foot. 14279 Spring Crest Dr is a home located in San Bernardino County with nearby schools including Country Springs Elementary School, Canyon Hills Junior High School, and Ruben S. Ayala High School.
Ownership History
Date
Name
Owned For
Owner Type
Purchase Details
Closed on
Oct 28, 2004
Sold by
Marsh Jerome J
Bought by
Marsh Jerome J and Marsh Karen L
Current Estimated Value
Purchase Details
Closed on
Dec 9, 1996
Sold by
Gonzales Mario R and Gonzales Aida G
Bought by
Marsh Jerome J and Marsh Karen L
Home Financials for this Owner
Home Financials are based on the most recent Mortgage that was taken out on this home.
Original Mortgage
$207,000
Interest Rate
6%
Purchase Details
Closed on
May 13, 1994
Sold by
Phh Homequity Corp
Bought by
Gonzales Mario R and Gonzales Aida G
Home Financials for this Owner
Home Financials are based on the most recent Mortgage that was taken out on this home.
Original Mortgage
$298,800
Interest Rate
5.5%
Purchase Details
Closed on
Dec 16, 1992
Sold by
Bradley Billy
Bought by
Phh Homequity Corp
Create a Home Valuation Report for This Property
The Home Valuation Report is an in-depth analysis detailing your home's value as well as a comparison with similar homes in the area
Home Values in the Area
Average Home Value in this Area
Purchase History
| Date | Buyer | Sale Price | Title Company |
|---|---|---|---|
| Marsh Jerome J | -- | -- | |
| Marsh Jerome J | $323,000 | North American Title Co | |
| Gonzales Mario R | $332,000 | Commonwealth Land Title Co | |
| Phh Homequity Corp | $360,000 | Commonwealth Land Title |
Source: Public Records
Mortgage History
| Date | Status | Borrower | Loan Amount |
|---|---|---|---|
| Previous Owner | Marsh Jerome J | $207,000 | |
| Previous Owner | Gonzales Mario R | $298,800 |
Source: Public Records
Tax History Compared to Growth
Tax History
| Year | Tax Paid | Tax Assessment Tax Assessment Total Assessment is a certain percentage of the fair market value that is determined by local assessors to be the total taxable value of land and additions on the property. | Land | Improvement |
|---|---|---|---|---|
| 2025 | $6,175 | $529,935 | $162,867 | $367,068 |
| 2024 | $6,175 | $519,545 | $159,674 | $359,871 |
| 2023 | $6,017 | $509,358 | $156,543 | $352,815 |
| 2022 | $5,982 | $499,371 | $153,474 | $345,897 |
| 2021 | $5,874 | $489,580 | $150,465 | $339,115 |
| 2020 | $5,804 | $484,560 | $148,922 | $335,638 |
| 2019 | $5,710 | $475,059 | $146,002 | $329,057 |
| 2018 | $5,593 | $465,744 | $143,139 | $322,605 |
| 2017 | $5,501 | $456,611 | $140,332 | $316,279 |
| 2016 | $5,172 | $447,657 | $137,580 | $310,077 |
| 2015 | $5,077 | $440,932 | $135,513 | $305,419 |
| 2014 | $5,539 | $432,294 | $132,858 | $299,436 |
Source: Public Records
Map
Nearby Homes
- 2460 Windmill Creek Rd
- 2286 Black Pine Rd
- 14171 Shoreline Dr
- 14726 Moon Crest Ln Unit E
- 2515 Pointe Coupee
- 14748 Moon Crest Ln Unit E
- 2432 Moon Dust Dr Unit B
- 2509 Moon Dust Dr Unit A
- 14155 Applegate Ln
- 3056 Giant Forest Loop
- 13663 Monteverde Dr
- 1839 Nordic Ave
- 15036 Calle la Paloma
- 15075 Avenida Del Monte
- 3248 Giant Forest Loop
- 13530 Tawny Ln
- 3159 Morningfield Dr
- 3167 Morningfield Dr
- 2024 Vista Del Sol
- 15085 Calle Verano
- 14291 Spring Crest Dr
- 14278 Spring Crest Dr
- 14311 Spring Crest Dr
- 14290 Spring Crest Dr
- 14310 Spring Crest Dr
- 14319 Spring Crest Dr
- 14318 Spring Crest Dr
- 14327 Spring Crest Dr
- 14293 Spring Vista Ln
- 14281 Spring Vista Ln
- 14309 Spring Vista Ln
- 14326 Spring Crest Dr
- 14335 Spring Crest Dr
- 14321 Spring Vista Ln
- 14336 Spring Crest Dr
- 14280 Spring Vista Ln
- 2449 Creekside Run
- 14343 Spring Crest Dr
- 2461 Creekside Run
- 14333 Spring Vista Ln