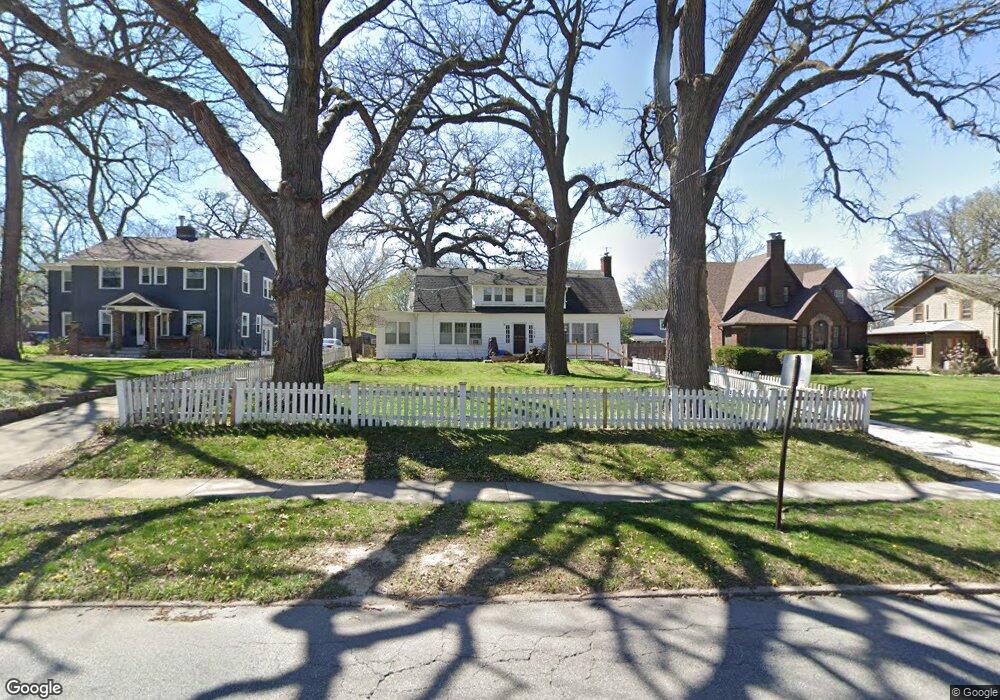
1428 41st St Des Moines, IA 50311
Beaverdale NeighborhoodEstimated Value: $272,000 - $343,556
4
Beds
3
Baths
2,726
Sq Ft
$113/Sq Ft
Est. Value
About This Home
This home is located at 1428 41st St, Des Moines, IA 50311 and is currently estimated at $307,778, approximately $112 per square foot. 1428 41st St is a home located in Polk County with nearby schools including Perkins Elementary School, Merrill Middle School, and Roosevelt High School.
Ownership History
Date
Name
Owned For
Owner Type
Purchase Details
Closed on
Oct 1, 2001
Sold by
Junge Eric M and Junge Melissa
Bought by
Klein Linda J
Current Estimated Value
Home Financials for this Owner
Home Financials are based on the most recent Mortgage that was taken out on this home.
Original Mortgage
$120,000
Outstanding Balance
$44,267
Interest Rate
6.25%
Mortgage Type
Commercial
Estimated Equity
$263,511
Create a Home Valuation Report for This Property
The Home Valuation Report is an in-depth analysis detailing your home's value as well as a comparison with similar homes in the area
Home Values in the Area
Average Home Value in this Area
Purchase History
| Date | Buyer | Sale Price | Title Company |
|---|---|---|---|
| Klein Linda J | $149,500 | -- |
Source: Public Records
Mortgage History
| Date | Status | Borrower | Loan Amount |
|---|---|---|---|
| Open | Klein Linda J | $120,000 |
Source: Public Records
Tax History Compared to Growth
Tax History
| Year | Tax Paid | Tax Assessment Tax Assessment Total Assessment is a certain percentage of the fair market value that is determined by local assessors to be the total taxable value of land and additions on the property. | Land | Improvement |
|---|---|---|---|---|
| 2025 | $5,004 | $300,800 | $65,100 | $235,700 |
| 2024 | $5,004 | $271,800 | $58,500 | $213,300 |
| 2023 | $5,240 | $271,800 | $58,500 | $213,300 |
| 2022 | $5,194 | $231,200 | $51,800 | $179,400 |
| 2021 | $5,008 | $231,000 | $51,800 | $179,200 |
| 2020 | $5,198 | $209,300 | $47,300 | $162,000 |
| 2019 | $4,882 | $209,300 | $47,300 | $162,000 |
| 2018 | $4,828 | $190,200 | $42,100 | $148,100 |
| 2017 | $4,284 | $190,200 | $42,100 | $148,100 |
| 2016 | $4,168 | $166,900 | $36,900 | $130,000 |
| 2015 | $4,168 | $166,900 | $36,900 | $130,000 |
| 2014 | $3,750 | $155,400 | $34,200 | $121,200 |
Source: Public Records
Map
Nearby Homes
- 1529 41st St
- 1534 41st St
- 1503 42nd St
- 3919 Maquoketa Dr
- 1333 39th St
- 1541 42nd St
- 1659 Northwest Dr
- 3827 Carpenter Ave
- 1347 44th St
- 1541 44th St
- 1206 39th St
- 1314 44th St
- 1669 Beaver Ave
- 1725 41st St
- 3821 University Ave
- 1242 37th St
- 4000 University Ave Unit 7
- 1415 46th St
- 1653 Marella Trail
- 4004 Franklin Ave