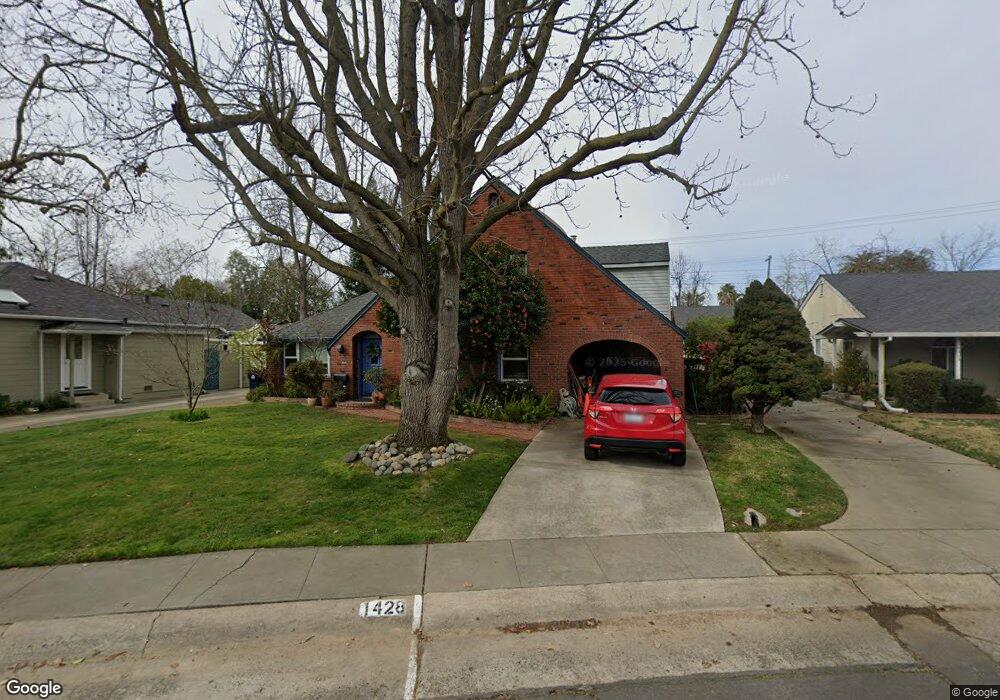
1428 52nd St Sacramento, CA 95819
East Sacramento NeighborhoodEstimated Value: $760,000 - $1,364,000
4
Beds
2
Baths
3,155
Sq Ft
$303/Sq Ft
Est. Value
About This Home
This home is located at 1428 52nd St, Sacramento, CA 95819 and is currently estimated at $955,756, approximately $302 per square foot. 1428 52nd St is a home located in Sacramento County with nearby schools including Caleb Greenwood Elementary, Umoja International Academy, and Hiram W. Johnson High School.
Ownership History
Date
Name
Owned For
Owner Type
Purchase Details
Closed on
Oct 1, 2020
Sold by
Blaise Jon W and Blaise Joan S
Bought by
Blaise Jon W and Blaise Joan S
Current Estimated Value
Home Financials for this Owner
Home Financials are based on the most recent Mortgage that was taken out on this home.
Original Mortgage
$234,300
Interest Rate
2.8%
Mortgage Type
New Conventional
Purchase Details
Closed on
Aug 13, 2012
Sold by
Blaise Jon W and Blaise Joan S
Bought by
Blaise Jon W and Blaise Joan S
Home Financials for this Owner
Home Financials are based on the most recent Mortgage that was taken out on this home.
Original Mortgage
$284,700
Interest Rate
3.56%
Mortgage Type
New Conventional
Purchase Details
Closed on
Jan 26, 2012
Sold by
Blaise Jon W and Blaise Joan S
Bought by
Blaise Jon W and Blaise Joan S
Home Financials for this Owner
Home Financials are based on the most recent Mortgage that was taken out on this home.
Original Mortgage
$286,800
Interest Rate
3.85%
Mortgage Type
New Conventional
Purchase Details
Closed on
Sep 1, 2011
Sold by
Blaise Jon W and Blaise Joan S
Bought by
Blaise Jon W and Blaise Joan S
Home Financials for this Owner
Home Financials are based on the most recent Mortgage that was taken out on this home.
Original Mortgage
$288,000
Interest Rate
4.37%
Mortgage Type
New Conventional
Purchase Details
Closed on
Jul 13, 2010
Sold by
Blaise Jon W and Blaise Joan S
Bought by
Blaise Jon W and Blaise Joan S
Home Financials for this Owner
Home Financials are based on the most recent Mortgage that was taken out on this home.
Original Mortgage
$292,500
Interest Rate
4.76%
Mortgage Type
New Conventional
Purchase Details
Closed on
Jan 30, 2009
Sold by
Blaise Jon W and Blaise Joan S
Bought by
Blaise Jon W and Blaise Joan S
Create a Home Valuation Report for This Property
The Home Valuation Report is an in-depth analysis detailing your home's value as well as a comparison with similar homes in the area
Home Values in the Area
Average Home Value in this Area
Purchase History
| Date | Buyer | Sale Price | Title Company |
|---|---|---|---|
| Blaise Jon W | -- | Fidelity National Title Co | |
| Blaise Jon W | -- | Fidelity National Title Co | |
| Blaise Jon W | -- | First American Title Company | |
| Blaise Jon W | -- | Fisrt American Title Company | |
| Blaise Jon W | -- | First American Title Company | |
| Blaise Jon W | -- | First American Title Company | |
| Blaise Jon W | -- | First American Title Company | |
| Blaise Jon W | -- | First American Title Company | |
| Blaise Jon W | -- | Fidelity National Title Co | |
| Blaise Jon W | -- | Fidelity National Title Co | |
| Blaise Jon W | -- | None Available | |
| Blaise Jon W | -- | None Available |
Source: Public Records
Mortgage History
| Date | Status | Borrower | Loan Amount |
|---|---|---|---|
| Closed | Blaise Jon W | $234,300 | |
| Closed | Blaise Jon W | $284,700 | |
| Closed | Blaise Jon W | $286,800 | |
| Closed | Blaise Jon W | $288,000 | |
| Closed | Blaise Jon W | $292,500 |
Source: Public Records
Tax History Compared to Growth
Tax History
| Year | Tax Paid | Tax Assessment Tax Assessment Total Assessment is a certain percentage of the fair market value that is determined by local assessors to be the total taxable value of land and additions on the property. | Land | Improvement |
|---|---|---|---|---|
| 2025 | $1,837 | $152,606 | $16,130 | $136,476 |
| 2024 | $1,837 | $149,614 | $15,814 | $133,800 |
| 2023 | $1,792 | $146,681 | $15,504 | $131,177 |
| 2022 | $1,760 | $143,805 | $15,200 | $128,605 |
| 2021 | $1,678 | $140,986 | $14,902 | $126,084 |
| 2020 | $1,688 | $139,542 | $14,750 | $124,792 |
| 2019 | $1,652 | $136,807 | $14,461 | $122,346 |
| 2018 | $1,608 | $134,126 | $14,178 | $119,948 |
| 2017 | $1,584 | $131,497 | $13,900 | $117,597 |
| 2016 | $1,496 | $128,920 | $13,628 | $115,292 |
| 2015 | $1,473 | $126,985 | $13,424 | $113,561 |
| 2014 | $1,433 | $124,517 | $13,173 | $111,344 |
Source: Public Records
Map
Nearby Homes