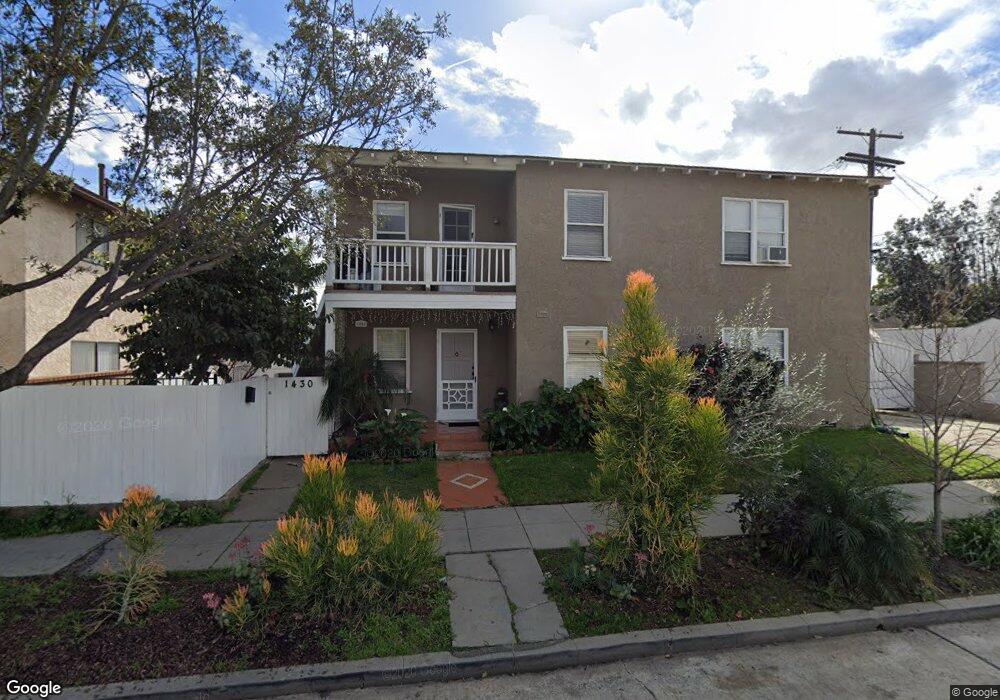
1428 E 36th St Long Beach, CA 90807
California Heights NeighborhoodEstimated Value: $984,141 - $1,402,000
5
Beds
2
Baths
1,964
Sq Ft
$593/Sq Ft
Est. Value
About This Home
This home is located at 1428 E 36th St, Long Beach, CA 90807 and is currently estimated at $1,165,535, approximately $593 per square foot. 1428 E 36th St is a home located in Los Angeles County with nearby schools including Longfellow Elementary School, Hughes Middle School, and Long Beach Polytechnic High School.
Ownership History
Date
Name
Owned For
Owner Type
Purchase Details
Closed on
Sep 27, 2002
Sold by
Castro Veronica
Bought by
Castro Guadalupe and Castro Adela
Current Estimated Value
Home Financials for this Owner
Home Financials are based on the most recent Mortgage that was taken out on this home.
Original Mortgage
$153,700
Outstanding Balance
$65,002
Interest Rate
6.28%
Estimated Equity
$1,100,533
Purchase Details
Closed on
Oct 6, 1999
Sold by
Castro Guadalupe
Bought by
Castro Guadalupe and Castro Adela
Purchase Details
Closed on
Jun 24, 1997
Sold by
Salcedo Ezequiel
Bought by
Castro Guadalupe and Castro Adela
Purchase Details
Closed on
Mar 31, 1997
Sold by
Campbell Douglas W
Bought by
Castro Guadalupe and Castro Adela
Home Financials for this Owner
Home Financials are based on the most recent Mortgage that was taken out on this home.
Original Mortgage
$152,100
Interest Rate
7.98%
Create a Home Valuation Report for This Property
The Home Valuation Report is an in-depth analysis detailing your home's value as well as a comparison with similar homes in the area
Home Values in the Area
Average Home Value in this Area
Purchase History
| Date | Buyer | Sale Price | Title Company |
|---|---|---|---|
| Castro Guadalupe | -- | Chicago | |
| Castro Guadalupe | -- | -- | |
| Castro Guadalupe | -- | -- | |
| Castro Guadalupe | $169,000 | Fidelity National Title Ins |
Source: Public Records
Mortgage History
| Date | Status | Borrower | Loan Amount |
|---|---|---|---|
| Open | Castro Guadalupe | $153,700 | |
| Previous Owner | Castro Guadalupe | $152,100 |
Source: Public Records
Tax History
| Year | Tax Paid | Tax Assessment Tax Assessment Total Assessment is a certain percentage of the fair market value that is determined by local assessors to be the total taxable value of land and additions on the property. | Land | Improvement |
|---|---|---|---|---|
| 2025 | $4,059 | $294,031 | $108,946 | $185,085 |
| 2024 | $4,059 | $288,266 | $106,810 | $181,456 |
| 2023 | $3,989 | $282,615 | $104,716 | $177,899 |
| 2022 | $3,755 | $277,074 | $102,663 | $174,411 |
| 2021 | $3,670 | $271,642 | $100,650 | $170,992 |
| 2019 | $3,618 | $263,586 | $97,665 | $165,921 |
| 2018 | $3,476 | $258,418 | $95,750 | $162,668 |
| 2016 | $3,192 | $248,385 | $92,033 | $156,352 |
| 2015 | $3,069 | $244,655 | $90,651 | $154,004 |
| 2014 | $3,057 | $239,864 | $88,876 | $150,988 |
Source: Public Records
Map
Nearby Homes
- 3580 Gundry Ave
- 3403 Falcon Ave
- 1190 E 37th St
- 3730 Walnut Ave
- 3454 Cerritos Ave
- 1168 E 37th St
- 3654 Cerritos Ave
- 3747 Falcon Ave
- 0 Cherry Ave Unit 26640275
- 3431 Myrtle Ave
- 3360 Myrtle Ave
- 3581 Olive Ave
- 3435 Olive Ave
- 3901 Cherry Ave
- 4196 4198 Del Mar Ave
- 3565 3565 Linden Unit 235
- 4595 407 California Ave
- 3725 Lime Ave
- 1331 E Marshall Place
- 3905 California Ave
- 3595 Falcon Ave
- 3583 Falcon Ave
- 1420 E 36th St
- 3569 Falcon Ave
- 3590 Gundry Ave Unit 1/2
- 3590 Gundry Ave
- 3601 Falcon Ave
- 3582 Gundry Ave
- 3596 Gundry Ave
- 3567 Falcon Ave
- 3605 Falcon Ave
- 3602 Gundry Ave
- 3570 Gundry Ave
- 1506 E 36th St
- 3566 Gundry Ave
- 3609 Falcon Ave
- 3561 Falcon Ave
- 3584 Falcon Ave
- 3610 Gundry Ave
- 3602 Falcon Ave
Your Personal Tour Guide
Ask me questions while you tour the home.