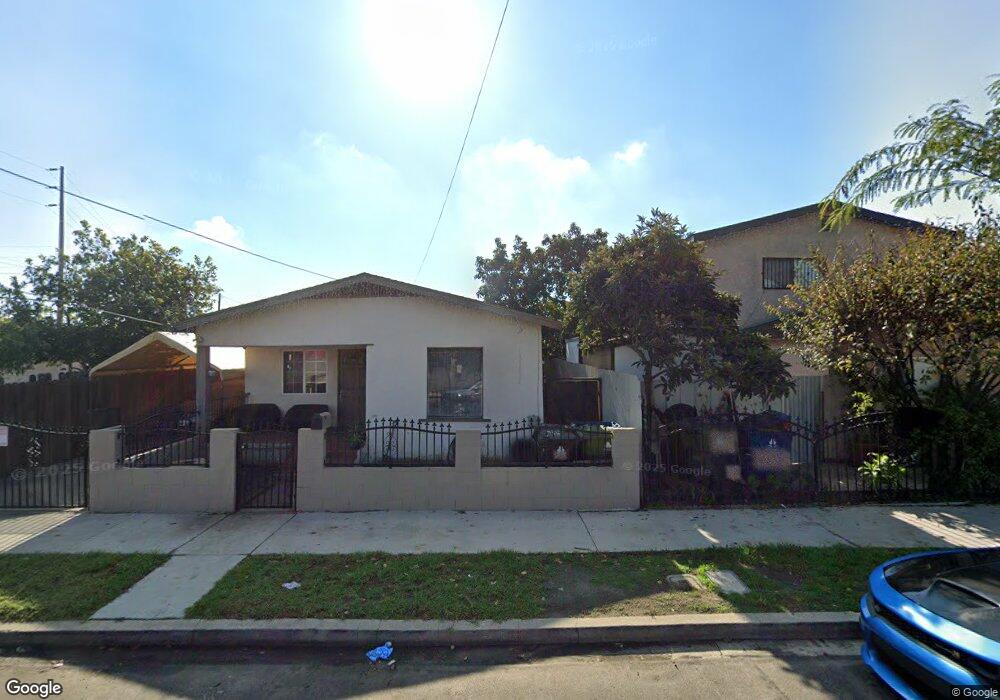
1428 E Denni St Wilmington, CA 90744
Estimated Value: $697,000 - $804,000
4
Beds
2
Baths
1,722
Sq Ft
$436/Sq Ft
Est. Value
About This Home
This home is located at 1428 E Denni St, Wilmington, CA 90744 and is currently estimated at $751,527, approximately $436 per square foot. 1428 E Denni St is a home located in Los Angeles County with nearby schools including Wilmington Park Elementary, Wilmington Middle School STEAM Magnet, and Phineas Banning Senior High School.
Ownership History
Date
Name
Owned For
Owner Type
Purchase Details
Closed on
Nov 30, 2003
Sold by
Yanez Rene
Bought by
Yanez Rene and Yanez Luciano
Current Estimated Value
Purchase Details
Closed on
Jul 22, 1999
Sold by
Yanez Pedro and Yanez Yolanda V
Bought by
Yanez Rene
Home Financials for this Owner
Home Financials are based on the most recent Mortgage that was taken out on this home.
Original Mortgage
$76,370
Outstanding Balance
$21,392
Interest Rate
7.56%
Mortgage Type
FHA
Estimated Equity
$730,135
Purchase Details
Closed on
Jul 20, 1999
Sold by
Yanez Salvador and Yanez Virginia
Bought by
Yanez Rene
Home Financials for this Owner
Home Financials are based on the most recent Mortgage that was taken out on this home.
Original Mortgage
$76,370
Outstanding Balance
$21,392
Interest Rate
7.56%
Mortgage Type
FHA
Estimated Equity
$730,135
Create a Home Valuation Report for This Property
The Home Valuation Report is an in-depth analysis detailing your home's value as well as a comparison with similar homes in the area
Home Values in the Area
Average Home Value in this Area
Purchase History
| Date | Buyer | Sale Price | Title Company |
|---|---|---|---|
| Yanez Rene | -- | -- | |
| Yanez Rene | $38,500 | South Coast Title | |
| Yanez Rene | $38,500 | South Coast Title |
Source: Public Records
Mortgage History
| Date | Status | Borrower | Loan Amount |
|---|---|---|---|
| Open | Yanez Rene | $76,370 | |
| Closed | Yanez Rene | $76,370 |
Source: Public Records
Tax History
| Year | Tax Paid | Tax Assessment Tax Assessment Total Assessment is a certain percentage of the fair market value that is determined by local assessors to be the total taxable value of land and additions on the property. | Land | Improvement |
|---|---|---|---|---|
| 2025 | $3,410 | $261,261 | $138,314 | $122,947 |
| 2024 | $3,410 | $256,139 | $135,602 | $120,537 |
| 2023 | $3,349 | $251,118 | $132,944 | $118,174 |
| 2022 | $3,200 | $246,195 | $130,338 | $115,857 |
| 2021 | $3,154 | $241,369 | $127,783 | $113,586 |
| 2020 | $3,181 | $238,895 | $126,473 | $112,422 |
| 2019 | $3,065 | $234,212 | $123,994 | $110,218 |
| 2018 | $2,982 | $229,620 | $121,563 | $108,057 |
| 2016 | $2,837 | $220,706 | $116,844 | $103,862 |
| 2015 | $2,798 | $217,391 | $115,089 | $102,302 |
| 2014 | $2,819 | $213,134 | $112,835 | $100,299 |
Source: Public Records
Map
Nearby Homes
- 1515 E Young St
- 1144 Blinn Ave
- 1339 E M St
- 1422 E Mauretania St
- 1301 E Pacific Coast Hwy
- 1127 Mcfarland Ave
- 832 Mcfarland Ave
- 1437 E Colon St
- 1402 E O St
- 1520 E Sandison St
- 1217 Cary Ave
- 947 Via Camino Unit 11
- 1425 Seagrove Ave
- 902 Foote Ave
- 1118 N Avalon Blvd
- 1526 Lakme Ave
- 1056 N Fries Ave
- 1262 N Lagoon Ave
- 823 Lagoon Ave
- 515 W Anaheim St
- 1418 E Denni St
- 1420 E Denni St
- 1047 Blinn Ave
- 1039 Blinn Ave
- 1035 Blinn Ave
- 1031 Blinn Ave
- 1042 Mahar Ave
- 1040 Mahar Ave
- 1406 E Denni St
- 1025 Blinn Ave Unit 1
- 1036 Mahar Ave
- 1021 Blinn Ave
- 1021 Blinn Ave Unit 1
- 1032 Mahar Ave
- 1042 Blinn Ave
- 1048 Blinn Ave
- 1036 Blinn Ave
- 1019 Blinn Ave
- 1028 Mahar Ave
- 1032 Blinn Ave
Your Personal Tour Guide
Ask me questions while you tour the home.