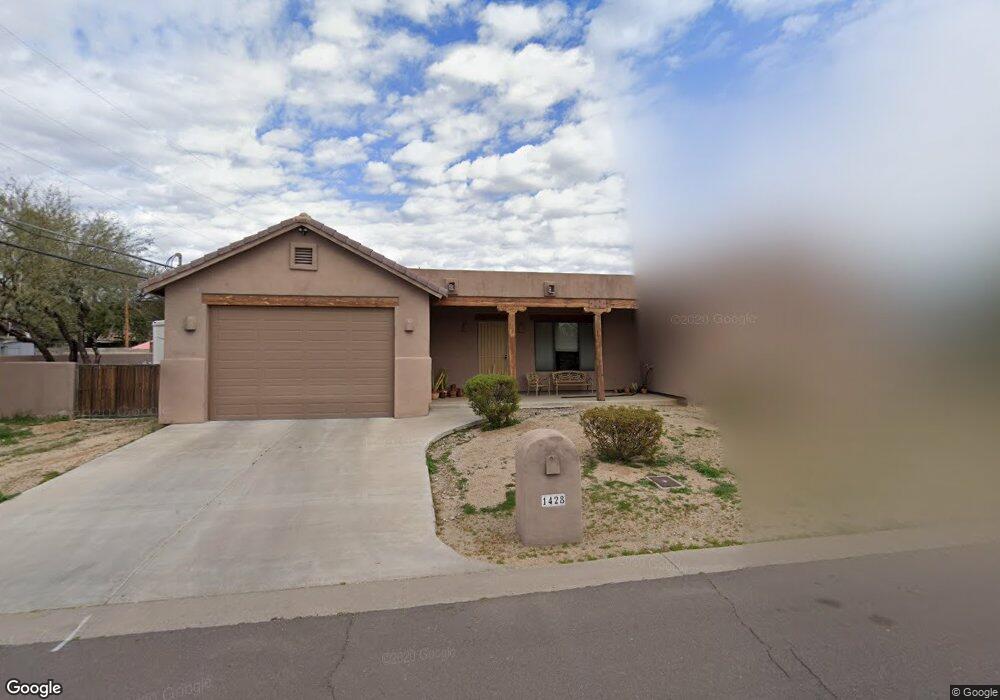
1428 E Shangri la Rd Phoenix, AZ 85020
North Mountain Village NeighborhoodEstimated Value: $512,000 - $668,000
Studio
3
Baths
2,620
Sq Ft
$221/Sq Ft
Est. Value
About This Home
This home is located at 1428 E Shangri la Rd, Phoenix, AZ 85020 and is currently estimated at $579,705, approximately $221 per square foot. 1428 E Shangri la Rd is a home located in Maricopa County with nearby schools including Larkspur Elementary School, Shea Middle School, and Shadow Mountain High School.
Ownership History
Date
Name
Owned For
Owner Type
Purchase Details
Closed on
Jul 27, 2020
Sold by
Brown Bobbie and Brown Stocks Trust
Bought by
Stocks Thomas F and Brown Bobbie
Current Estimated Value
Home Financials for this Owner
Home Financials are based on the most recent Mortgage that was taken out on this home.
Original Mortgage
$219,000
Outstanding Balance
$155,848
Interest Rate
3.1%
Mortgage Type
New Conventional
Estimated Equity
$423,857
Purchase Details
Closed on
Sep 27, 2017
Sold by
Brown Bobbie A
Bought by
Brown Bobbie and Brown Stocks Trust
Purchase Details
Closed on
Nov 3, 2010
Sold by
Stock Sjr Thomas F
Bought by
Brown Bobbie A
Home Financials for this Owner
Home Financials are based on the most recent Mortgage that was taken out on this home.
Original Mortgage
$277,750
Interest Rate
4.25%
Mortgage Type
FHA
Purchase Details
Closed on
Jul 31, 2003
Sold by
Valdez Gilbert A
Bought by
Stocks Thomas F and Brown Bobbie
Home Financials for this Owner
Home Financials are based on the most recent Mortgage that was taken out on this home.
Original Mortgage
$37,000
Interest Rate
5.13%
Mortgage Type
Purchase Money Mortgage
Create a Home Valuation Report for This Property
The Home Valuation Report is an in-depth analysis detailing your home's value as well as a comparison with similar homes in the area
Home Values in the Area
Average Home Value in this Area
Purchase History
| Date | Buyer | Sale Price | Title Company |
|---|---|---|---|
| Stocks Thomas F | -- | None Available | |
| Brown Bobbie | -- | None Available | |
| Brown Bobbie A | -- | Title Management Agency Of A | |
| Stocks Thomas F | $37,000 | Old Republic Title Agency |
Source: Public Records
Mortgage History
| Date | Status | Borrower | Loan Amount |
|---|---|---|---|
| Open | Stocks Thomas F | $219,000 | |
| Closed | Brown Bobbie A | $277,750 | |
| Previous Owner | Stocks Thomas F | $37,000 |
Source: Public Records
Tax History
| Year | Tax Paid | Tax Assessment Tax Assessment Total Assessment is a certain percentage of the fair market value that is determined by local assessors to be the total taxable value of land and additions on the property. | Land | Improvement |
|---|---|---|---|---|
| 2025 | $2,545 | $29,387 | -- | -- |
| 2024 | $2,423 | $27,988 | -- | -- |
| 2023 | $2,423 | $46,930 | $9,380 | $37,550 |
| 2022 | $2,400 | $37,520 | $7,500 | $30,020 |
| 2021 | $2,440 | $37,630 | $7,520 | $30,110 |
| 2020 | $2,356 | $41,060 | $8,210 | $32,850 |
| 2019 | $2,367 | $38,810 | $7,760 | $31,050 |
| 2018 | $2,281 | $29,850 | $5,970 | $23,880 |
| 2017 | $2,178 | $30,180 | $6,030 | $24,150 |
| 2016 | $2,144 | $26,050 | $5,210 | $20,840 |
Source: Public Records
Map
Nearby Homes
- 11016 N 15th St
- 11411 N 15th St
- 1343 E Lupine Ave
- 1425 E Desert Cove Ave Unit 33A
- 1425 E Desert Cove Ave Unit 13B
- 1409 E Cortez St
- 11021 N 13th St
- 1233 E Desert Cove Ave
- 1409 E Sunnyside Dr Unit 9
- 1232 E Lupine Ave
- 1533 E Sunnyside Dr
- 1228 E Lupine Ave
- 1522 E Sunnyside Dr Unit 20
- 1219 E Christy Dr
- 10838 N 12th St
- 1230 E Peoria Ave
- 10410 N Cave Creek Rd Unit 2063
- 10410 N Cave Creek Rd Unit 1115
- 10410 N Cave Creek Rd Unit 1230
- 10410 N Cave Creek Rd Unit 1027
- 1422 E Shangri la Rd
- 1437 E Yucca St
- 1427 E Yucca St
- 11130 N 15th St
- 11201 N 15th St
- 1501 E Yucca St
- 1421 E Shangri la Rd Unit 3
- 1423 E Yucca St
- 1417 E Shangri la Rd
- 1502 E Yucca St
- 0 SE 0000 St
- 1524 E Shangri la Rd
- 1524 E Shangri la Rd
- 1524 E Shangri la Rd Unit 1
- 1508 E Yucca St --
- 1413 E Shangri la Rd Unit 2
- 1508 E Yucca St
- 1508 E Yucca St
- 1430 E Mescal St
- 1406 E Shangri la Rd
Your Personal Tour Guide
Ask me questions while you tour the home.