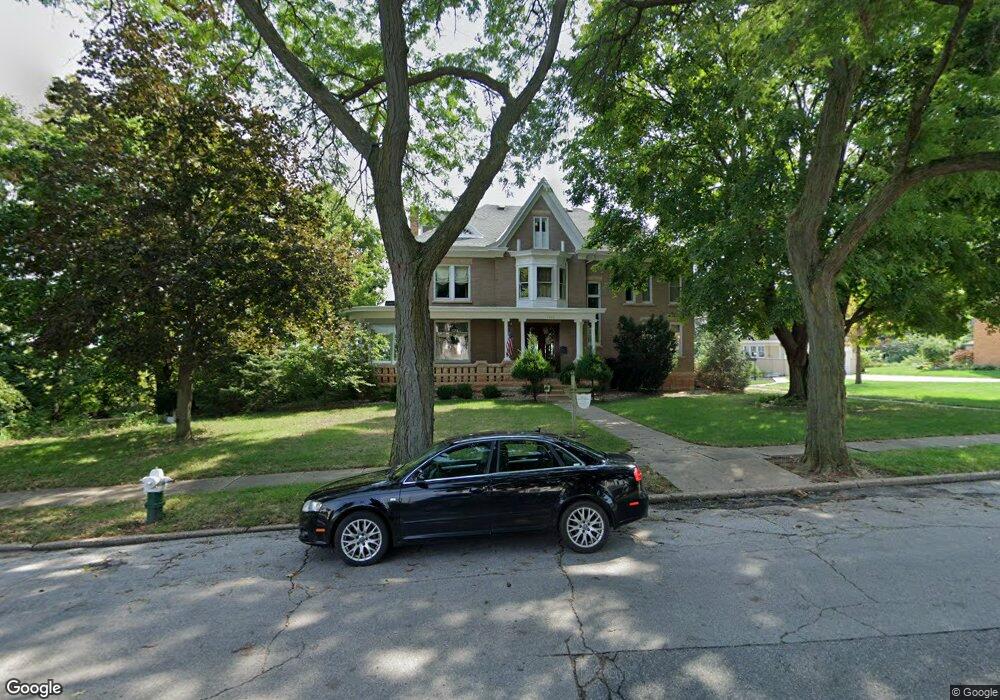
1428 N 7th St Burlington, IA 52601
Estimated Value: $343,000 - $519,000
6
Beds
4
Baths
4,377
Sq Ft
$102/Sq Ft
Est. Value
About This Home
This home is located at 1428 N 7th St, Burlington, IA 52601 and is currently estimated at $446,206, approximately $101 per square foot. 1428 N 7th St is a home located in Des Moines County with nearby schools including Burlington Community High School, Great River Christian School, and Burlington Christian School.
Ownership History
Date
Name
Owned For
Owner Type
Purchase Details
Closed on
Apr 28, 2025
Sold by
Armstrong Melvin D and Armstrong Lucretia M
Bought by
Bruner Thomas W
Current Estimated Value
Purchase Details
Closed on
Sep 13, 2021
Sold by
Beck Lance T and Beck Angel R
Bought by
Armstrong Melvin D and Armstrong Lucretia M
Home Financials for this Owner
Home Financials are based on the most recent Mortgage that was taken out on this home.
Original Mortgage
$251,000
Interest Rate
2.7%
Mortgage Type
New Conventional
Create a Home Valuation Report for This Property
The Home Valuation Report is an in-depth analysis detailing your home's value as well as a comparison with similar homes in the area
Home Values in the Area
Average Home Value in this Area
Purchase History
| Date | Buyer | Sale Price | Title Company |
|---|---|---|---|
| Bruner Thomas W | $535,000 | None Listed On Document | |
| Armstrong Melvin D | $351,000 | None Listed On Document |
Source: Public Records
Mortgage History
| Date | Status | Borrower | Loan Amount |
|---|---|---|---|
| Previous Owner | Armstrong Melvin D | $251,000 |
Source: Public Records
Tax History Compared to Growth
Tax History
| Year | Tax Paid | Tax Assessment Tax Assessment Total Assessment is a certain percentage of the fair market value that is determined by local assessors to be the total taxable value of land and additions on the property. | Land | Improvement |
|---|---|---|---|---|
| 2025 | $6,430 | $415,900 | $21,100 | $394,800 |
| 2024 | $6,430 | $330,900 | $21,100 | $309,800 |
| 2023 | $5,616 | $330,900 | $21,100 | $309,800 |
| 2022 | $5,684 | $288,100 | $21,100 | $267,000 |
| 2021 | $5,684 | $288,100 | $21,100 | $267,000 |
| 2020 | $6,060 | $288,100 | $21,100 | $267,000 |
| 2019 | $6,938 | $288,100 | $21,100 | $267,000 |
| 2018 | $6,944 | $310,000 | $29,700 | $280,300 |
| 2017 | $8,318 | $353,100 | $0 | $0 |
| 2016 | $7,842 | $353,100 | $0 | $0 |
| 2015 | $7,842 | $353,100 | $0 | $0 |
| 2014 | $7,942 | $206,800 | $0 | $0 |
Source: Public Records
Map
Nearby Homes