Estimated Value: $146,000 - $210,000
3
Beds
2
Baths
1,964
Sq Ft
$92/Sq Ft
Est. Value
About This Home
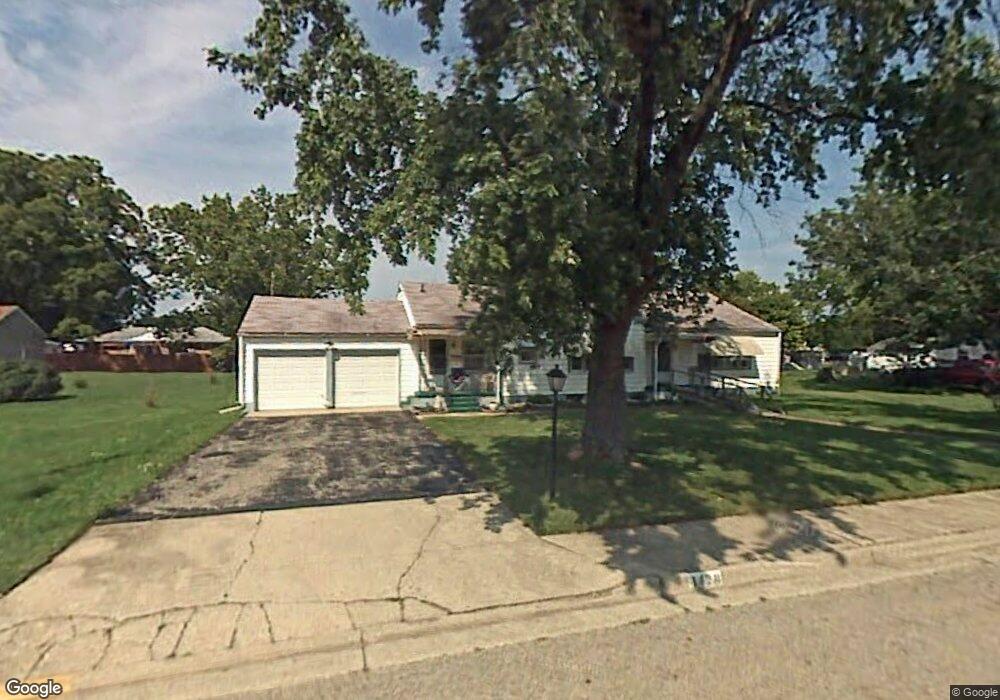
This home is located at 1428 W Grant St, Piqua, OH 45356 and is currently estimated at $179,819, approximately $91 per square foot. 1428 W Grant St is a home located in Miami County with nearby schools including Piqua Junior High School, Piqua High School, and Nicholas School.
Ownership History
Date
Name
Owned For
Owner Type
Purchase Details
Closed on
May 31, 2022
Sold by
Wirrig John D
Bought by
Crowl Todd and Trainer Lisa
Current Estimated Value
Home Financials for this Owner
Home Financials are based on the most recent Mortgage that was taken out on this home.
Original Mortgage
$127,645
Outstanding Balance
$121,273
Interest Rate
5.1%
Mortgage Type
FHA
Estimated Equity
$58,546
Purchase Details
Closed on
Feb 22, 2022
Sold by
Wirrig John D
Bought by
Wirrig John D
Purchase Details
Closed on
Oct 26, 2017
Sold by
Wirrig John D
Bought by
Wirrig John D
Purchase Details
Closed on
Oct 16, 2017
Sold by
Wirrig John D and Wirrig Brenda E
Bought by
Ganger Jennifer D
Purchase Details
Closed on
Apr 28, 2016
Sold by
Wirrig John D
Bought by
Wirrig John D
Purchase Details
Closed on
Apr 26, 2001
Sold by
Star Bank Na Troy
Bought by
Wirrig John
Purchase Details
Closed on
Jan 1, 1990
Bought by
Wirrig Bernard E
Create a Home Valuation Report for This Property
The Home Valuation Report is an in-depth analysis detailing your home's value as well as a comparison with similar homes in the area
Home Values in the Area
Average Home Value in this Area
Purchase History
| Date | Buyer | Sale Price | Title Company |
|---|---|---|---|
| Crowl Todd | $130,000 | Mantica Christopher J | |
| Wirrig John D | -- | Huffman Landis Weaks & Walters | |
| Wirrig John D | -- | -- | |
| Ganger Jennifer D | -- | -- | |
| Wirrig John D | -- | Attorney | |
| Wirrig John | -- | -- | |
| Wirrig Bernard E | -- | -- |
Source: Public Records
Mortgage History
| Date | Status | Borrower | Loan Amount |
|---|---|---|---|
| Open | Crowl Todd | $127,645 |
Source: Public Records
Tax History Compared to Growth
Tax History
| Year | Tax Paid | Tax Assessment Tax Assessment Total Assessment is a certain percentage of the fair market value that is determined by local assessors to be the total taxable value of land and additions on the property. | Land | Improvement |
|---|---|---|---|---|
| 2024 | $1,894 | $46,100 | $11,240 | $34,860 |
| 2023 | $1,894 | $46,100 | $11,240 | $34,860 |
| 2022 | $1,978 | $46,100 | $11,240 | $34,860 |
| 2021 | $1,658 | $35,460 | $8,650 | $26,810 |
| 2020 | $1,630 | $35,460 | $8,650 | $26,810 |
| 2019 | $1,639 | $35,460 | $8,650 | $26,810 |
| 2018 | $1,600 | $33,010 | $8,650 | $24,360 |
| 2017 | $1,620 | $33,010 | $8,650 | $24,360 |
| 2016 | $1,604 | $33,010 | $8,650 | $24,360 |
| 2015 | $1,641 | $33,010 | $8,650 | $24,360 |
| 2014 | $1,641 | $33,010 | $8,650 | $24,360 |
| 2013 | $1,646 | $33,010 | $8,650 | $24,360 |
Source: Public Records
Map
Nearby Homes
- 1435 Covington Ave
- 1110 South St
- 1005 South St
- 708 Brice Ave
- 210 Lyndhurst Dr
- 605 Boal Ave
- 215 Levering Dr
- 403 Brentwood Ave
- 809 Candlewood Blvd
- 806 Candlewood Blvd
- 1133 W Water St
- 1200 W High St
- 920 New Haven Rd
- 918 Falmouth Ave
- 1505 Amherst Ave
- 825 Clark Ave
- 1320 Arrowhead
- 1513 Arrowhead Dr
- 914 Briarcliff Ave
- 1502 Arrowhead Dr
- 1416 W Grant St
- 1510 W Grant St
- 1497 Plum St
- 1493 Plum St
- 1501 Plum St
- 1431 W Grant St
- 1421 Plum St
- 1427 W Grant St
- 1509 W Grant St
- 303 Cedarbrook Dr
- 1423 W Grant St
- 1419 Plum St
- 1511 W Grant St
- 1410 W Grant St
- 301 Cedarbrook Dr
- 1415 Plum St
- 1421 W Grant St
- 1513 W Grant St
- 1413 Plum St
- 1413 Plum St Unit Piqua