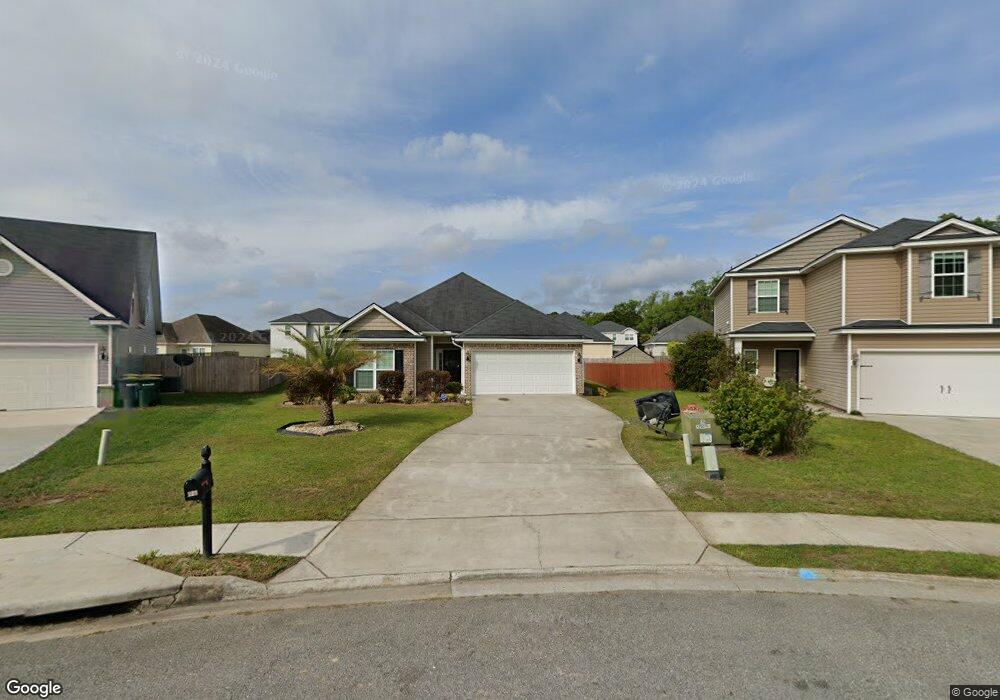
143 Calm Oak Cir Savannah, GA 31419
Estimated Value: $303,231 - $369,000
3
Beds
2
Baths
1,434
Sq Ft
$236/Sq Ft
Est. Value
About This Home
This home is located at 143 Calm Oak Cir, Savannah, GA 31419 and is currently estimated at $338,058, approximately $235 per square foot. 143 Calm Oak Cir is a home located in Chatham County with nearby schools including Southwest Elementary School, Windsor Forest High School, and Southwest Middle School.
Ownership History
Date
Name
Owned For
Owner Type
Purchase Details
Closed on
Apr 29, 2015
Sold by
Ernest Signature Custom Homes Llc
Bought by
Early Theresa
Current Estimated Value
Home Financials for this Owner
Home Financials are based on the most recent Mortgage that was taken out on this home.
Original Mortgage
$155,013
Outstanding Balance
$118,059
Interest Rate
3.37%
Mortgage Type
FHA
Estimated Equity
$219,999
Purchase Details
Closed on
Feb 20, 2014
Sold by
Ernest Communities Llc
Bought by
Ernest Signature Custom Homes
Home Financials for this Owner
Home Financials are based on the most recent Mortgage that was taken out on this home.
Original Mortgage
$129,600
Interest Rate
4.43%
Mortgage Type
New Conventional
Purchase Details
Closed on
Aug 30, 2007
Bought by
Ernest Communities Llc
Create a Home Valuation Report for This Property
The Home Valuation Report is an in-depth analysis detailing your home's value as well as a comparison with similar homes in the area
Home Values in the Area
Average Home Value in this Area
Purchase History
| Date | Buyer | Sale Price | Title Company |
|---|---|---|---|
| Early Theresa | $169,900 | -- | |
| Ernest Signature Custom Homes | $40,000 | -- | |
| Ernest Communities Llc | $1,033,900 | -- |
Source: Public Records
Mortgage History
| Date | Status | Borrower | Loan Amount |
|---|---|---|---|
| Open | Early Theresa | $155,013 | |
| Closed | Early Theresa | $15,000 | |
| Previous Owner | Ernest Signature Custom Homes | $129,600 |
Source: Public Records
Tax History Compared to Growth
Tax History
| Year | Tax Paid | Tax Assessment Tax Assessment Total Assessment is a certain percentage of the fair market value that is determined by local assessors to be the total taxable value of land and additions on the property. | Land | Improvement |
|---|---|---|---|---|
| 2025 | $1,899 | $100,040 | $26,000 | $74,040 |
| 2024 | $1,899 | $99,360 | $26,000 | $73,360 |
| 2023 | $694 | $92,840 | $22,000 | $70,840 |
| 2022 | $859 | $85,800 | $22,000 | $63,800 |
| 2021 | $2,578 | $76,280 | $22,000 | $54,280 |
| 2020 | $1,760 | $67,680 | $22,000 | $45,680 |
| 2019 | $2,575 | $67,680 | $22,000 | $45,680 |
| 2018 | $1,737 | $65,880 | $22,000 | $43,880 |
| 2017 | $1,554 | $59,360 | $22,000 | $37,360 |
| 2016 | $1,533 | $58,840 | $22,000 | $36,840 |
| 2015 | $2,472 | $59,280 | $22,000 | $37,280 |
| 2014 | $533 | $9,600 | $0 | $0 |
Source: Public Records
Map
Nearby Homes
- 206 Calm Oaks Cir
- 13 Club House Dr
- 13 Clubhouse Dr
- 17 Club House Dr
- 127 Iron Horse Spur
- 27 Primrose Ct
- 525 Sessile Oak Dr
- 205 Sessile Oak Dr
- 102 Pine Grove Dr
- 10 Barrington Cir
- 646 Sessile Oak Dr
- 541 Sessile Oak Dr
- 2 +/- AC Fawn Ln
- 56 Red Fox Dr
- Spring Mountain II Plan at Sweetwater Station
- Avery Plan at Sweetwater Station
- Richmond Plan at Sweetwater Station
- Dayton Plan at Sweetwater Station
- Spring Valley II Plan at Sweetwater Station
- Crestview Plan at Sweetwater Station
- 145 Calm Oak Cir
- 145 Calm Oaks Cir
- 141 Calm Oak Cir
- 193 Calm Oaks Cir
- 193 Calm Oak Cir
- 195 Calm Oak Cir
- 139 Calm Oaks Cir
- 147 Calm Oak Cir
- 0 Calm Oaks Cir Unit 8533188
- 0 Calm Oaks Cir Unit 8069924
- 0 Calm Oaks Cir Unit 9046109
- 0 Calm Oaks Cir
- 191 Calm Oak Cir
- 197 Calm Oak Cir
- 139 Calm Oak Cir
- 189 Calm Oak Cir
- 199 Calm Oak Cir
- 149 Calm Oak Cir
- 138 Calm Oak Cir
- 137 Calm Oak Cir