143 Carter Cir Youngstown, OH 44512
Estimated Value: $188,000 - $207,000
3
Beds
2
Baths
1,452
Sq Ft
$139/Sq Ft
Est. Value
About This Home
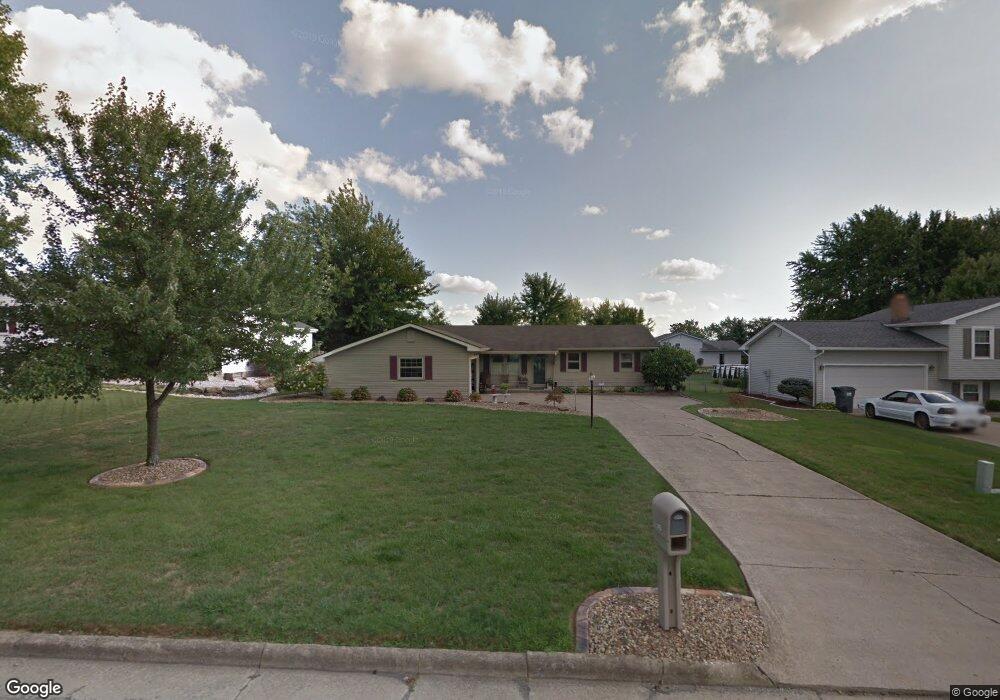
This home is located at 143 Carter Cir, Youngstown, OH 44512 and is currently estimated at $201,904, approximately $139 per square foot. 143 Carter Cir is a home located in Mahoning County with nearby schools including Stadium Drive Elementary School, Boardman Center Middle School, and Boardman High School.
Ownership History
Date
Name
Owned For
Owner Type
Purchase Details
Closed on
Aug 1, 2001
Sold by
Estate Of Edward C Strazik
Bought by
Langley Rosemary E and Strasik Gary E
Current Estimated Value
Purchase Details
Closed on
Sep 20, 2000
Sold by
Estate Of Josephine F Strazik
Bought by
Strazik Edward C and Langley Rosemary
Purchase Details
Closed on
Dec 1, 1978
Bought by
Langley Ronald E and R E
Create a Home Valuation Report for This Property
The Home Valuation Report is an in-depth analysis detailing your home's value as well as a comparison with similar homes in the area
Home Values in the Area
Average Home Value in this Area
Purchase History
| Date | Buyer | Sale Price | Title Company |
|---|---|---|---|
| Langley Rosemary E | -- | -- | |
| Strazik Edward C | -- | -- | |
| Langley Ronald E | -- | -- |
Source: Public Records
Tax History Compared to Growth
Tax History
| Year | Tax Paid | Tax Assessment Tax Assessment Total Assessment is a certain percentage of the fair market value that is determined by local assessors to be the total taxable value of land and additions on the property. | Land | Improvement |
|---|---|---|---|---|
| 2024 | $2,144 | $51,140 | $9,790 | $41,350 |
| 2023 | $2,147 | $51,140 | $9,790 | $41,350 |
| 2022 | $2,145 | $40,840 | $9,790 | $31,050 |
| 2021 | $2,146 | $40,840 | $9,790 | $31,050 |
| 2020 | $2,157 | $40,840 | $9,790 | $31,050 |
| 2019 | $1,847 | $32,410 | $7,770 | $24,640 |
| 2018 | $1,578 | $32,410 | $7,770 | $24,640 |
| 2017 | $1,537 | $32,410 | $7,770 | $24,640 |
| 2016 | $1,181 | $26,610 | $7,770 | $18,840 |
| 2015 | $1,159 | $26,610 | $7,770 | $18,840 |
| 2014 | $1,162 | $26,610 | $7,770 | $18,840 |
| 2013 | $1,148 | $26,610 | $7,770 | $18,840 |
Source: Public Records
Map
Nearby Homes
- 74 Carter Cir
- 8502 Glenwood Ave
- 153 Creston Dr
- 0 W Western Reserve Rd Unit 5146459
- 9144 Sharrott Rd
- 470 Garver Dr
- 9264 Sharrott Rd Unit 1004
- 9264 Sharrott Rd Unit 1001
- 9264 Sharrott Rd Unit 104
- 9264 Sharrott Rd Unit 1002
- Rosewood Plan at Courtyards at Stonegate
- 8218 Maramont Dr Unit B
- 123 Mayflower Dr
- 235 E Western Reserve Rd
- 134 Mayflower Dr
- 1555 W Western Reserve Rd
- 150 Cedars Dr
- Lot 43 Berklee Dr
- Lot 36 Berklee Dr
- Lot 44 Berklee Dr
- 139 Carter Cir
- 147 Carter Cir
- 144 Runnemede Dr
- 135 Carter Cir
- 151 Carter Cir
- 140 Runnemede Dr
- 148 Runnemede Dr
- 142 Carter Cir
- 146 Carter Cir
- 136 Runnemede Dr
- 152 Runnemede Dr
- 152 Runnemede Dr
- 138 Carter Cir
- 155 Carter Cir
- 131 Carter Cir
- 150 Carter Cir
- 134 Carter Cir
- 156 Runnemede Dr
- 132 Runnemede Dr
- 154 Carter Cir