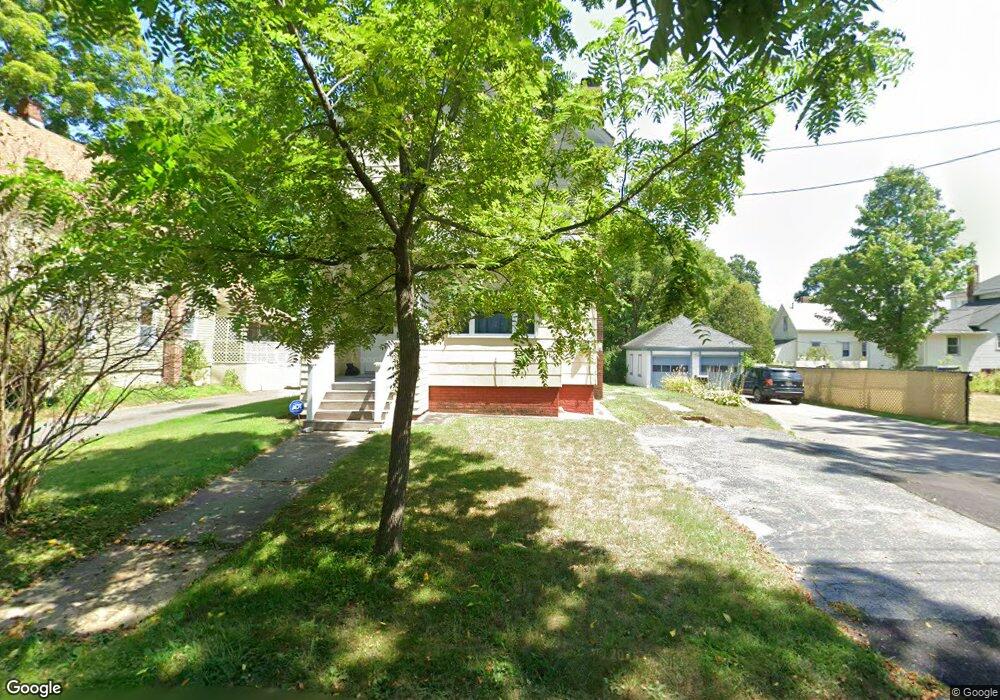
143 Cheney St Orange, MA 01364
Estimated Value: $281,204 - $367,000
3
Beds
2
Baths
1,650
Sq Ft
$191/Sq Ft
Est. Value
About This Home
This home is located at 143 Cheney St, Orange, MA 01364 and is currently estimated at $315,051, approximately $190 per square foot. 143 Cheney St is a home located in Franklin County with nearby schools including Fisher Hill and Ralph C Mahar Regional School.
Ownership History
Date
Name
Owned For
Owner Type
Purchase Details
Closed on
Jul 1, 2011
Sold by
Fnma
Bought by
Schofield Roger J and Schofield Donna
Current Estimated Value
Home Financials for this Owner
Home Financials are based on the most recent Mortgage that was taken out on this home.
Original Mortgage
$52,200
Outstanding Balance
$36,098
Interest Rate
4.62%
Mortgage Type
Purchase Money Mortgage
Estimated Equity
$278,953
Purchase Details
Closed on
Jun 23, 2011
Sold by
Hebert Lynn M
Bought by
Federal National Mortgage Association
Home Financials for this Owner
Home Financials are based on the most recent Mortgage that was taken out on this home.
Original Mortgage
$52,200
Outstanding Balance
$36,098
Interest Rate
4.62%
Mortgage Type
Purchase Money Mortgage
Estimated Equity
$278,953
Purchase Details
Closed on
Jul 3, 2007
Sold by
Delmar Robert J and Delmar Lauren T
Bought by
Hebert Lynn M and Broeckel Vincent
Home Financials for this Owner
Home Financials are based on the most recent Mortgage that was taken out on this home.
Original Mortgage
$165,000
Interest Rate
6.24%
Mortgage Type
Purchase Money Mortgage
Purchase Details
Closed on
Jun 2, 2003
Sold by
Johnson Herbert M Jr E and Oddy Pamela E
Bought by
Gilbert Lauren T and Delmar Robert J
Home Financials for this Owner
Home Financials are based on the most recent Mortgage that was taken out on this home.
Original Mortgage
$111,150
Interest Rate
5.86%
Mortgage Type
Purchase Money Mortgage
Create a Home Valuation Report for This Property
The Home Valuation Report is an in-depth analysis detailing your home's value as well as a comparison with similar homes in the area
Home Values in the Area
Average Home Value in this Area
Purchase History
| Date | Buyer | Sale Price | Title Company |
|---|---|---|---|
| Schofield Roger J | $58,000 | -- | |
| Federal National Mortgage Association | $126,388 | -- | |
| Hebert Lynn M | $165,000 | -- | |
| Gilbert Lauren T | $117,000 | -- |
Source: Public Records
Mortgage History
| Date | Status | Borrower | Loan Amount |
|---|---|---|---|
| Open | Gilbert Lauren T | $52,200 | |
| Previous Owner | Hebert Lynn M | $165,000 | |
| Previous Owner | Gilbert Lauren T | $111,150 |
Source: Public Records
Tax History Compared to Growth
Tax History
| Year | Tax Paid | Tax Assessment Tax Assessment Total Assessment is a certain percentage of the fair market value that is determined by local assessors to be the total taxable value of land and additions on the property. | Land | Improvement |
|---|---|---|---|---|
| 2025 | $39 | $239,300 | $22,700 | $216,600 |
| 2024 | $3,657 | $209,700 | $22,700 | $187,000 |
| 2023 | $3,281 | $182,700 | $20,400 | $162,300 |
| 2022 | $2,966 | $155,100 | $20,400 | $134,700 |
| 2021 | $2,957 | $147,500 | $41,700 | $105,800 |
| 2020 | $2,820 | $138,700 | $38,100 | $100,600 |
| 2019 | $2,772 | $123,100 | $32,900 | $90,200 |
| 2018 | $2,479 | $113,000 | $30,700 | $82,300 |
| 2017 | $2,399 | $113,000 | $30,700 | $82,300 |
| 2016 | $2,242 | $103,300 | $27,400 | $75,900 |
| 2015 | $2,077 | $100,000 | $29,300 | $70,700 |
| 2014 | $2,122 | $107,500 | $29,300 | $78,200 |
Source: Public Records
Map
Nearby Homes
- 137 Cheney St
- 20 Carpenter St
- 16 Carpenter St
- 25 W Myrtle St
- 15 W Myrtle St
- 204 S Main St
- 210 S Main St
- 152 Cheney St
- 152 Cheney St Unit 2
- 132 Cheney St
- 198 S Main St
- 218 S Main St
- Lot a Carpenter St
- 196 S Main St
- 196 S Main St Unit 1
- 25 Carpenter St
- 37 W Myrtle St
- 33 Carpenter St
- 224 S Main St
- 44 Carpenter St