143 Delk Rd Screven, GA 31560
Estimated Value: $219,457 - $293,000
--
Bed
2
Baths
1,676
Sq Ft
$154/Sq Ft
Est. Value
About This Home
This home is located at 143 Delk Rd, Screven, GA 31560 and is currently estimated at $258,114, approximately $154 per square foot. 143 Delk Rd is a home located in Wayne County with nearby schools including Screven Elementary School, Arthur Williams Middle School, and Wayne County High School.
Ownership History
Date
Name
Owned For
Owner Type
Purchase Details
Closed on
Jun 19, 2017
Sold by
Murray Karla
Bought by
Dawson Robert John
Current Estimated Value
Home Financials for this Owner
Home Financials are based on the most recent Mortgage that was taken out on this home.
Original Mortgage
$141,882
Outstanding Balance
$116,297
Interest Rate
3.5%
Mortgage Type
FHA
Estimated Equity
$141,817
Purchase Details
Closed on
Jun 24, 2013
Sold by
Murray Korey
Bought by
Murray Karla
Purchase Details
Closed on
Feb 1, 2002
Sold by
Pollard M Darryle
Bought by
Murray Korey and Murray Karla
Purchase Details
Closed on
Dec 1, 1994
Bought by
Pollard M Darryle
Create a Home Valuation Report for This Property
The Home Valuation Report is an in-depth analysis detailing your home's value as well as a comparison with similar homes in the area
Home Values in the Area
Average Home Value in this Area
Purchase History
| Date | Buyer | Sale Price | Title Company |
|---|---|---|---|
| Dawson Robert John | $144,500 | -- | |
| Murray Karla | -- | -- | |
| Murray Korey | $13,000 | -- | |
| Pollard M Darryle | $4,500 | -- |
Source: Public Records
Mortgage History
| Date | Status | Borrower | Loan Amount |
|---|---|---|---|
| Open | Dawson Robert John | $141,882 |
Source: Public Records
Tax History Compared to Growth
Tax History
| Year | Tax Paid | Tax Assessment Tax Assessment Total Assessment is a certain percentage of the fair market value that is determined by local assessors to be the total taxable value of land and additions on the property. | Land | Improvement |
|---|---|---|---|---|
| 2024 | $1,774 | $71,976 | $1,918 | $70,058 |
| 2023 | $1,898 | $63,266 | $1,918 | $61,348 |
| 2022 | $1,450 | $51,071 | $1,918 | $49,153 |
| 2021 | $1,340 | $44,744 | $1,918 | $42,826 |
| 2020 | $1,434 | $46,102 | $3,276 | $42,826 |
| 2019 | $1,477 | $46,102 | $3,276 | $42,826 |
| 2018 | $1,477 | $46,102 | $3,276 | $42,826 |
| 2017 | $1,271 | $46,102 | $3,276 | $42,826 |
| 2016 | $1,230 | $46,102 | $3,276 | $42,826 |
| 2014 | $1,233 | $46,102 | $3,276 | $42,826 |
| 2013 | -- | $46,102 | $3,276 | $42,826 |
Source: Public Records
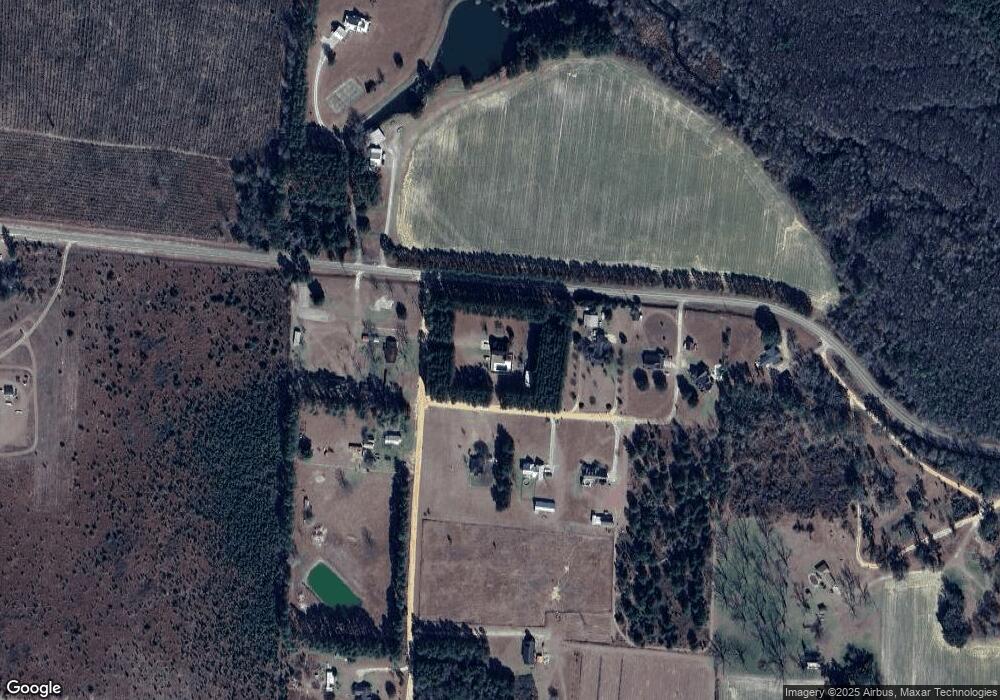
Map
Nearby Homes
- 301 Whitaker Dr
- 102 Highsmith Ave
- 406 Cw Collins St
- 107 Gaffney St
- 0 Dale Mill Rd
- 109 Joyner St
- 868 Broadhurst Rd W
- 9009 Waycross Hwy
- 59 Enoch Moody Rd
- 0 S Forks Rd
- 391 S Forks Rd
- 362 Crosby Ln
- 7132 Waycross Hwy
- 7114 Waycross Hwy
- 7014 Waycross Hwy
- 1435 E Lake Dr
- 188 Bennetts Cir
- 675 Foxwood Cir
- 1351 Old Screven Rd
- 4866 Kville Rd