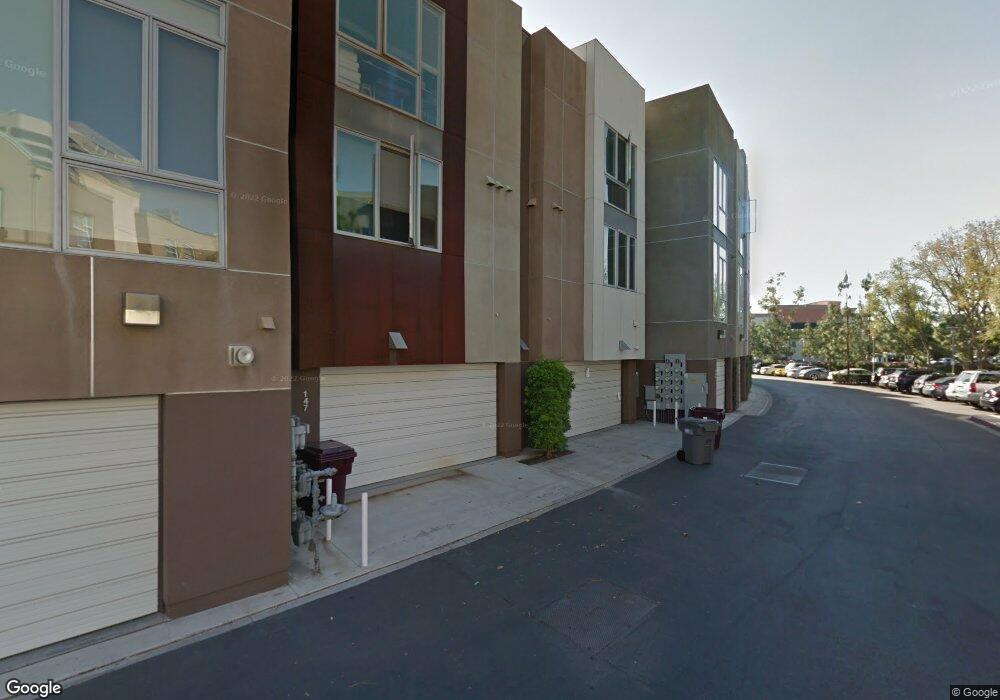
143 E City Place Dr Unit 159 Santa Ana, CA 92705
Morrison Park NeighborhoodEstimated Value: $756,000 - $1,008,860
1
Bed
3
Baths
1,640
Sq Ft
$535/Sq Ft
Est. Value
About This Home
This home is located at 143 E City Place Dr Unit 159, Santa Ana, CA 92705 and is currently estimated at $877,715, approximately $535 per square foot. 143 E City Place Dr Unit 159 is a home located in Orange County with nearby schools including Fairhaven Elementary School, Portola Middle School, and Orange High School.
Ownership History
Date
Name
Owned For
Owner Type
Purchase Details
Closed on
Oct 21, 2019
Sold by
Zhu Haodong
Bought by
Zhu Lipeng and Zhang Yu
Current Estimated Value
Purchase Details
Closed on
Oct 9, 2019
Sold by
Meritage Homes Of California Inc
Bought by
Zhu Haodong
Purchase Details
Closed on
Sep 27, 2016
Sold by
Eshghi Rayhanen M and Leavitt Michael
Bought by
Wavro David C
Home Financials for this Owner
Home Financials are based on the most recent Mortgage that was taken out on this home.
Original Mortgage
$536,287
Interest Rate
3.42%
Mortgage Type
VA
Purchase Details
Closed on
Apr 28, 2011
Sold by
Main Street Concourse Llc
Bought by
Eshghi Rayhaneh M and Leavitt Michael
Home Financials for this Owner
Home Financials are based on the most recent Mortgage that was taken out on this home.
Original Mortgage
$301,920
Interest Rate
3.75%
Mortgage Type
New Conventional
Create a Home Valuation Report for This Property
The Home Valuation Report is an in-depth analysis detailing your home's value as well as a comparison with similar homes in the area
Home Values in the Area
Average Home Value in this Area
Purchase History
| Date | Buyer | Sale Price | Title Company |
|---|---|---|---|
| Zhu Lipeng | -- | None Available | |
| Zhu Haodong | $860,000 | First American Title Hsd | |
| Wavro David C | $540,000 | Western Resources Title Co | |
| Eshghi Rayhaneh M | $377,500 | First American Title Company |
Source: Public Records
Mortgage History
| Date | Status | Borrower | Loan Amount |
|---|---|---|---|
| Previous Owner | Wavro David C | $536,287 | |
| Previous Owner | Eshghi Rayhaneh M | $301,920 |
Source: Public Records
Tax History Compared to Growth
Tax History
| Year | Tax Paid | Tax Assessment Tax Assessment Total Assessment is a certain percentage of the fair market value that is determined by local assessors to be the total taxable value of land and additions on the property. | Land | Improvement |
|---|---|---|---|---|
| 2025 | $6,808 | $626,713 | $368,461 | $258,252 |
| 2024 | $6,808 | $614,425 | $361,236 | $253,189 |
| 2023 | $6,656 | $602,378 | $354,153 | $248,225 |
| 2022 | $6,526 | $590,567 | $347,209 | $243,358 |
| 2021 | $6,342 | $578,988 | $340,401 | $238,587 |
| 2020 | $6,283 | $573,052 | $336,911 | $236,141 |
| 2019 | $6,203 | $561,816 | $330,305 | $231,511 |
| 2018 | $6,107 | $550,800 | $323,828 | $226,972 |
| 2017 | $5,853 | $540,000 | $317,478 | $222,522 |
| 2016 | $4,488 | $408,443 | $181,689 | $226,754 |
| 2015 | $4,422 | $402,308 | $178,960 | $223,348 |
| 2014 | $4,327 | $394,428 | $175,455 | $218,973 |
Source: Public Records
Map
Nearby Homes
- 320 Jeanette Ln Unit 62
- 253 Jeanette Ln Unit 39
- 452 E Jeanette Ln
- 2556 Valencia St N
- 712 S Grable Cir
- 773 S Grable Cir
- 521 W Memory Ln
- 700 W La Veta Ave Unit O5
- 700 W La Veta Ave Unit G8
- 700 W La Veta Ave Unit M12
- 700 W La Veta Ave Unit I8
- 700 W La Veta Ave Unit T4
- 700 W La Veta Ave Unit H7
- 700 W La Veta Ave Unit E4
- 700 W La Veta Ave Unit F3
- 2404 Poinsettia St N
- 611 S La Veta Park Cir Unit 228
- 2850 N Stone Pine Glen
- 501 S Parker St
- 2327 Bonnie Brae
- 141 E City Place Dr
- 145 E City Place Dr Unit 158
- 139 E City Place Dr Unit 161
- 137 E City Place Dr
- 137 E City Place Dr Unit 162
- 135 E City Place Dr Unit 163
- 161 E City Place Dr
- 103 E City Place Dr
- 193 E City Place Dr
- 121 E City Place Dr
- 179 E City Place Dr Unit 138
- 105 E City Place Dr Unit 115
- 189 E City Place Dr
- 119 E City Place Dr
- 105 E City Place Dr
- 107 E City Place Dr
- 123 E City Place Dr
- 153 E City Place Dr
- 147 E City Place Dr Unit 157
- 149 E City Place Dr Unit 156