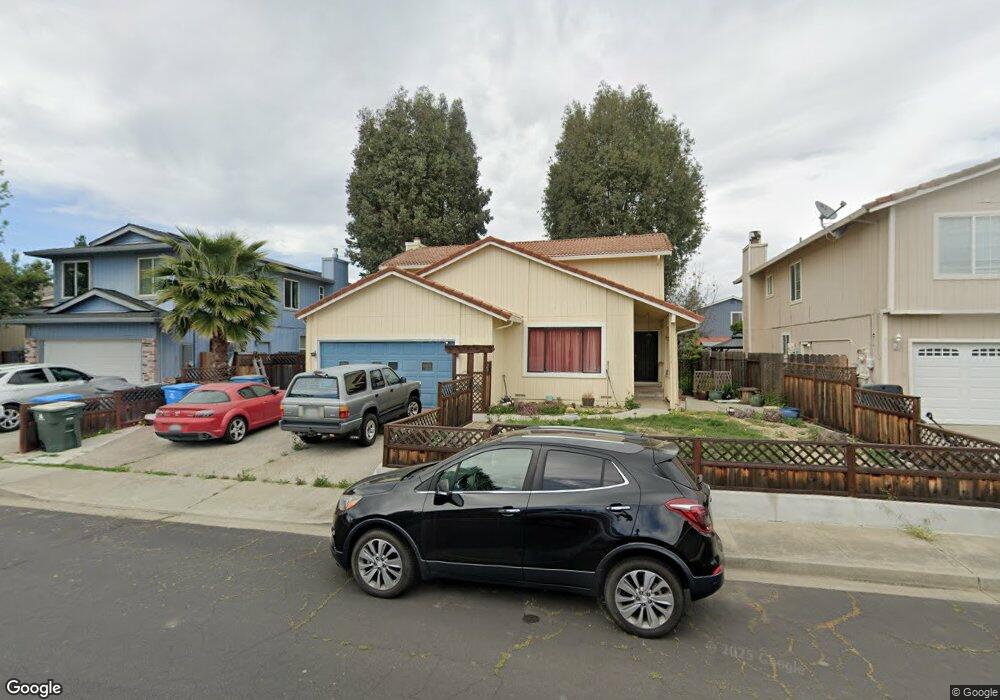
143 Glasgow Way Vacaville, CA 95687
Estimated Value: $532,605 - $570,000
3
Beds
3
Baths
1,626
Sq Ft
$338/Sq Ft
Est. Value
About This Home
This home is located at 143 Glasgow Way, Vacaville, CA 95687 and is currently estimated at $549,901, approximately $338 per square foot. 143 Glasgow Way is a home located in Solano County with nearby schools including Jean Callison Elementary School, Orchard Elementary School, and Vaca Pena Middle School.
Ownership History
Date
Name
Owned For
Owner Type
Purchase Details
Closed on
Sep 30, 2014
Sold by
Robertson Herman J
Bought by
Terry Robertson Stacey D
Current Estimated Value
Purchase Details
Closed on
Mar 4, 1998
Sold by
Robertson Herman Jessie and Terry Robertson Stacey
Bought by
Robertson Herman Jessie and Terry Robertson Stacey
Home Financials for this Owner
Home Financials are based on the most recent Mortgage that was taken out on this home.
Original Mortgage
$150,911
Outstanding Balance
$27,827
Interest Rate
7.11%
Mortgage Type
VA
Estimated Equity
$522,074
Purchase Details
Closed on
Jun 18, 1997
Sold by
Emc Mtg Corp
Bought by
Robertson Herman Jessie and Terry Robertson Stacey
Home Financials for this Owner
Home Financials are based on the most recent Mortgage that was taken out on this home.
Original Mortgage
$143,820
Interest Rate
7.94%
Mortgage Type
VA
Purchase Details
Closed on
Sep 20, 1996
Sold by
Mark Demanincor
Bought by
Emc Mtg Corp
Create a Home Valuation Report for This Property
The Home Valuation Report is an in-depth analysis detailing your home's value as well as a comparison with similar homes in the area
Home Values in the Area
Average Home Value in this Area
Purchase History
| Date | Buyer | Sale Price | Title Company |
|---|---|---|---|
| Terry Robertson Stacey D | -- | None Available | |
| Robertson Herman Jessie | -- | -- | |
| Robertson Herman Jessie | $141,000 | Fidelity National Title Co | |
| Emc Mtg Corp | $102,482 | Chicago Title Co |
Source: Public Records
Mortgage History
| Date | Status | Borrower | Loan Amount |
|---|---|---|---|
| Open | Robertson Herman Jessie | $150,911 | |
| Closed | Robertson Herman Jessie | $143,820 |
Source: Public Records
Tax History Compared to Growth
Tax History
| Year | Tax Paid | Tax Assessment Tax Assessment Total Assessment is a certain percentage of the fair market value that is determined by local assessors to be the total taxable value of land and additions on the property. | Land | Improvement |
|---|---|---|---|---|
| 2025 | $2,565 | $229,639 | $65,142 | $164,497 |
| 2024 | $2,565 | $225,137 | $63,865 | $161,272 |
| 2023 | $2,503 | $220,723 | $62,613 | $158,110 |
| 2022 | $2,437 | $216,396 | $61,386 | $155,010 |
| 2021 | $2,440 | $212,154 | $60,183 | $151,971 |
| 2020 | $2,407 | $209,979 | $59,566 | $150,413 |
| 2019 | $2,363 | $205,863 | $58,399 | $147,464 |
| 2018 | $2,336 | $201,827 | $57,254 | $144,573 |
| 2017 | $2,257 | $197,871 | $56,132 | $141,739 |
| 2016 | $2,239 | $193,992 | $55,032 | $138,960 |
| 2015 | $2,209 | $191,079 | $54,206 | $136,873 |
| 2014 | $2,068 | $187,337 | $53,145 | $134,192 |
Source: Public Records
Map
Nearby Homes
- 163 Stirling Dr
- 1055 Woodridge Dr
- 1084 Woodridge Dr
- 1136 Woodridge Dr
- 1801 Marshall Rd Unit 408
- 1801 Marshall Rd Unit 908
- 1801 Marshall Rd Unit 705
- 128 Clark Way
- 190 Fairview Dr
- 190 Huntington Dr
- 642 White Oak Ln
- 512 Oakmeadow Ct
- 3642 Alamo Dr
- 122 Village Ct
- 854 Owl Cir
- 2600 Nut Tree Rd
- 106 Village Ct
- 332 Plantation Ct
- 719 Beelard Dr
- 124 Dover Way