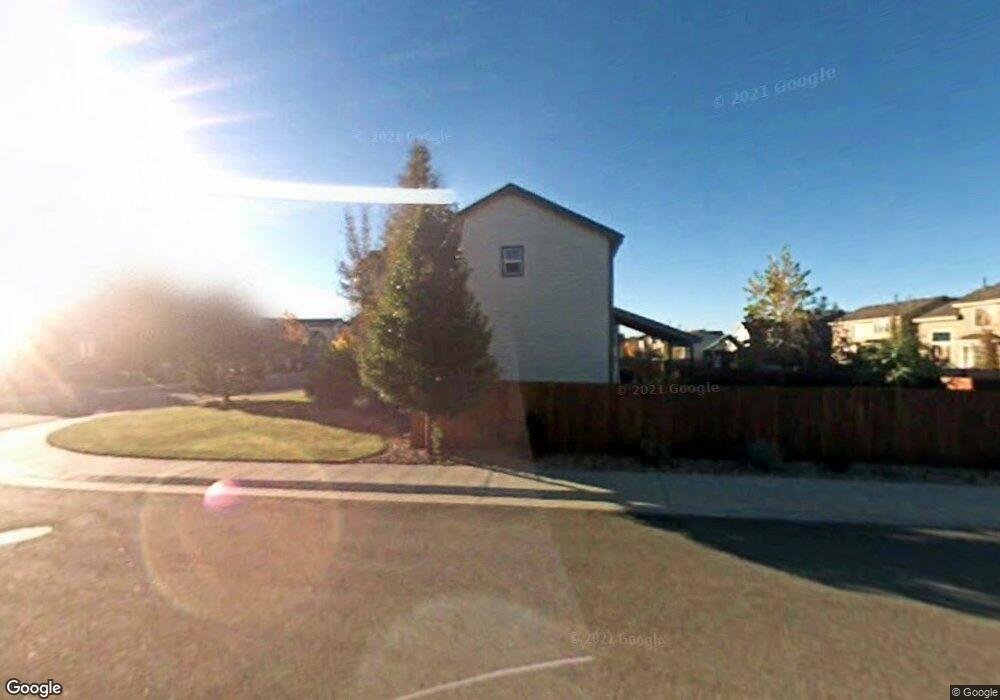
143 Mesa St Brighton, CO 80601
Estimated Value: $502,691 - $560,000
4
Beds
4
Baths
1,752
Sq Ft
$305/Sq Ft
Est. Value
About This Home
This home is located at 143 Mesa St, Brighton, CO 80601 and is currently estimated at $533,923, approximately $304 per square foot. 143 Mesa St is a home located in Adams County with nearby schools including Pennock Elementary School, Overland Trail Middle School, and Brighton High School.
Ownership History
Date
Name
Owned For
Owner Type
Purchase Details
Closed on
Mar 17, 2016
Sold by
Tellez Patricia and Tellez Patricia Sa
Bought by
Tellez Patricia
Current Estimated Value
Home Financials for this Owner
Home Financials are based on the most recent Mortgage that was taken out on this home.
Original Mortgage
$234,025
Outstanding Balance
$183,821
Interest Rate
3.75%
Mortgage Type
FHA
Estimated Equity
$350,102
Purchase Details
Closed on
Jun 28, 2012
Sold by
Hagen Terry L
Bought by
Tellez Ricardo F and Tellez Patricia Sa
Home Financials for this Owner
Home Financials are based on the most recent Mortgage that was taken out on this home.
Original Mortgage
$201,286
Interest Rate
4.37%
Mortgage Type
FHA
Purchase Details
Closed on
May 23, 2001
Sold by
The Ryland Group Inc
Bought by
Hagen Terry L
Home Financials for this Owner
Home Financials are based on the most recent Mortgage that was taken out on this home.
Original Mortgage
$85,000
Interest Rate
7.01%
Create a Home Valuation Report for This Property
The Home Valuation Report is an in-depth analysis detailing your home's value as well as a comparison with similar homes in the area
Home Values in the Area
Average Home Value in this Area
Purchase History
| Date | Buyer | Sale Price | Title Company |
|---|---|---|---|
| Tellez Patricia | -- | None Available | |
| Tellez Ricardo F | $205,000 | Land Title Guarantee Company | |
| Hagen Terry L | $228,726 | Cornerstone Title Co |
Source: Public Records
Mortgage History
| Date | Status | Borrower | Loan Amount |
|---|---|---|---|
| Open | Tellez Patricia | $234,025 | |
| Closed | Tellez Ricardo F | $201,286 | |
| Previous Owner | Hagen Terry L | $85,000 |
Source: Public Records
Tax History
| Year | Tax Paid | Tax Assessment Tax Assessment Total Assessment is a certain percentage of the fair market value that is determined by local assessors to be the total taxable value of land and additions on the property. | Land | Improvement |
|---|---|---|---|---|
| 2025 | $3,882 | $36,650 | $7,820 | $28,830 |
| 2024 | $3,882 | $33,690 | $7,190 | $26,500 |
| 2023 | $3,859 | $38,500 | $6,770 | $31,730 |
| 2022 | $3,235 | $29,170 | $6,950 | $22,220 |
| 2021 | $3,045 | $29,170 | $6,950 | $22,220 |
| 2020 | $2,656 | $26,580 | $7,150 | $19,430 |
| 2019 | $2,662 | $26,580 | $7,150 | $19,430 |
| 2018 | $2,245 | $22,350 | $6,120 | $16,230 |
| 2017 | $2,248 | $22,350 | $6,120 | $16,230 |
| 2016 | $1,811 | $17,910 | $4,460 | $13,450 |
| 2015 | $1,799 | $17,910 | $4,460 | $13,450 |
| 2014 | -- | $15,180 | $3,580 | $11,600 |
Source: Public Records
Map
Nearby Homes
- 220 Terra Vista St
- 334 Octillo St
- 3060 E Bridge St Unit 38
- 3060 E Bridge St Unit 206
- 3060 E Bridge St Unit 349
- 3060 E Bridge St Unit 159
- 3060 E Bridge St Unit 317
- 3060 E Bridge St Unit 441
- 3060 E Bridge St Unit 213
- 3060 E Bridge St Unit 320
- 3060 E Bridge St Unit 35
- 3060 E Bridge St
- 3060 E Bridge St Unit 120
- 253 Beldock Ct
- 128 Chapel Hill Cir
- 3778 Chavez St
- 147 Chapel Hill Cir
- 370 S 30th Ave
- 3978 Balderas St
- 4109 Grand Lake St
- 153 Mesa St
- 140 Terra Vista St
- 163 Mesa St
- 150 Terra Vista St
- 112 Mesa St
- 122 Mesa St
- 160 Terra Vista St
- 152 Mesa St
- 142 Mesa St
- 173 Mesa St
- 111 Terra Vista St
- 162 Mesa St
- 170 Terra Vista St
- 183 Mesa St
- 121 Terra Vista St
- 172 Mesa St
- 180 Terra Vista St
- 151 Terra Vista St
- 141 Terra Vista St
- 145 Octillo St
Your Personal Tour Guide
Ask me questions while you tour the home.