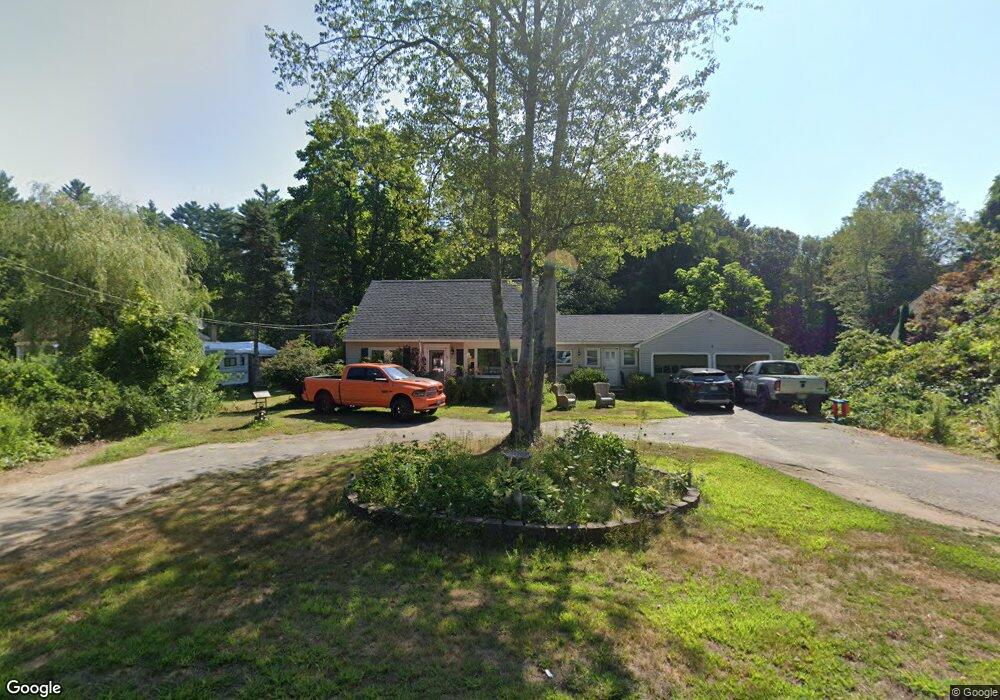
143 N Main St Newton, NH 03858
Estimated Value: $553,450 - $586,000
3
Beds
2
Baths
1,939
Sq Ft
$295/Sq Ft
Est. Value
About This Home
This home is located at 143 N Main St, Newton, NH 03858 and is currently estimated at $572,363, approximately $295 per square foot. 143 N Main St is a home located in Rockingham County with nearby schools including Memorial School, Sanborn Regional Middle School, and Sanborn Regional High School.
Ownership History
Date
Name
Owned For
Owner Type
Purchase Details
Closed on
Nov 12, 1999
Sold by
Cruz Fernando and Cruz Susan M
Bought by
Aro Lisa A
Current Estimated Value
Purchase Details
Closed on
Jun 2, 1997
Sold by
Fhlmc
Bought by
Cruz Susan M and Cruz Fernandito
Purchase Details
Closed on
May 8, 1997
Sold by
Demers Robert H and Demers Donna L
Bought by
Gmac Mtg Corp Of Pa
Create a Home Valuation Report for This Property
The Home Valuation Report is an in-depth analysis detailing your home's value as well as a comparison with similar homes in the area
Home Values in the Area
Average Home Value in this Area
Purchase History
| Date | Buyer | Sale Price | Title Company |
|---|---|---|---|
| Aro Lisa A | $138,000 | -- | |
| Cruz Susan M | $111,400 | -- | |
| Gmac Mtg Corp Of Pa | $110,000 | -- |
Source: Public Records
Mortgage History
| Date | Status | Borrower | Loan Amount |
|---|---|---|---|
| Open | Gmac Mtg Corp Of Pa | $155,000 | |
| Closed | Gmac Mtg Corp Of Pa | $132,000 | |
| Closed | Gmac Mtg Corp Of Pa | $133,000 |
Source: Public Records
Tax History Compared to Growth
Tax History
| Year | Tax Paid | Tax Assessment Tax Assessment Total Assessment is a certain percentage of the fair market value that is determined by local assessors to be the total taxable value of land and additions on the property. | Land | Improvement |
|---|---|---|---|---|
| 2024 | $7,849 | $309,400 | $122,300 | $187,100 |
| 2023 | $7,614 | $309,400 | $122,300 | $187,100 |
| 2022 | $6,958 | $309,400 | $122,300 | $187,100 |
| 2021 | $6,466 | $309,400 | $122,300 | $187,100 |
| 2020 | $6,577 | $309,400 | $122,300 | $187,100 |
| 2019 | $6,513 | $246,900 | $87,700 | $159,200 |
| 2018 | $6,316 | $246,900 | $87,700 | $159,200 |
| 2017 | $7,166 | $246,900 | $87,700 | $159,200 |
| 2016 | $6,459 | $246,900 | $87,700 | $159,200 |
| 2015 | $6,461 | $246,900 | $87,700 | $159,200 |
| 2014 | $6,360 | $245,200 | $87,700 | $157,500 |
| 2013 | $6,204 | $245,200 | $87,700 | $157,500 |
Source: Public Records
Map
Nearby Homes
- 9 Bowley Rd
- 142 Haverhill Rd
- 129 Haverhill Rd
- 43 Maple Ave
- 155 Chase Rd
- 7 Coopers Grove Rd
- 40 Coopers Grove Rd
- 17 Maple Ave
- 15 Maple St
- 57b New Boston Rd
- 11 & 13 Dulcies Point Rd
- 12 Dulcies Point Rd
- 8 Dulcies Point Rd
- 21 Currier St
- 21 Marcoux Rd
- 10 Pennimans Grove Rd
- 56 Whittier St
- 7 Grebenstein Dr
- 14 Folly Brook Terrace Unit B
- 10 Folly Brook Terrace