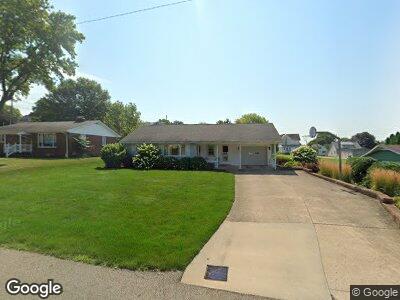
143 Ronsan St SW Sugarcreek, OH 44681
Estimated Value: $198,000 - $227,000
3
Beds
2
Baths
1,096
Sq Ft
$198/Sq Ft
Est. Value
About This Home
This home is located at 143 Ronsan St SW, Sugarcreek, OH 44681 and is currently estimated at $217,058, approximately $198 per square foot. 143 Ronsan St SW is a home located in Tuscarawas County with nearby schools including Garaway High School, Genza Bottom, and OAK RIDGE SCHOOL.
Ownership History
Date
Name
Owned For
Owner Type
Purchase Details
Closed on
Nov 24, 2020
Sold by
Hamsher Esther
Bought by
Miller Brenda Y
Current Estimated Value
Purchase Details
Closed on
Mar 20, 1990
Sold by
Hamsher James A and Hamsher Esther
Bought by
Hamsher James A and Esther Hamsher
Create a Home Valuation Report for This Property
The Home Valuation Report is an in-depth analysis detailing your home's value as well as a comparison with similar homes in the area
Home Values in the Area
Average Home Value in this Area
Purchase History
| Date | Buyer | Sale Price | Title Company |
|---|---|---|---|
| Miller Brenda Y | -- | None Available | |
| Hamsher James A | -- | -- |
Source: Public Records
Tax History Compared to Growth
Tax History
| Year | Tax Paid | Tax Assessment Tax Assessment Total Assessment is a certain percentage of the fair market value that is determined by local assessors to be the total taxable value of land and additions on the property. | Land | Improvement |
|---|---|---|---|---|
| 2024 | $1,809 | $160,540 | $39,600 | $120,940 |
| 2023 | $1,809 | $160,540 | $39,600 | $120,940 |
| 2022 | $1,866 | $56,189 | $13,860 | $42,329 |
| 2021 | $1,564 | $46,082 | $12,156 | $33,926 |
| 2020 | $1,568 | $46,082 | $12,156 | $33,926 |
| 2019 | $1,576 | $46,082 | $12,156 | $33,926 |
| 2018 | $727 | $38,890 | $10,260 | $28,630 |
| 2017 | $1,212 | $38,890 | $10,260 | $28,630 |
| 2016 | $1,214 | $38,890 | $10,260 | $28,630 |
| 2014 | $1,153 | $37,090 | $9,900 | $27,190 |
| 2013 | $1,077 | $37,090 | $9,900 | $27,190 |
Source: Public Records
Map
Nearby Homes
- 232 Church St SW
- 221 5th St SW
- 131 Maple St SW
- 163 Heritage Crossing SE
- 0 Cherry Ridge Dr SW Unit 5106181
- 9659 Yoder Rd SW
- 0 Yoder Rd SW
- 0 Winklepleck Rd NW
- 186 Pleasant Valley Rd SW
- 3004 Winklepleck Rd NW
- 3860 Township Road 162
- 3850 Township Road 162
- 5467 Old Route 39 NW
- 4991 Walnut St
- 3153 Boltz Orchard Rd SW
- 127 Buena Vista St
- 125 Buena Vista St
- 121 Buena Vista St
- 0 Hilltop Rd Unit 5119979
- 0 Hilltop Rd Unit 5119982
- 143 Ronsan St SW
- 153 Ronsan St SW
- 135 Ronsan St SW
- 125 Ronsan St SW
- 138 Church St SW
- 144 Church St SW
- 144 Ronsan St SW
- 161 Ronsan St SW
- 154 Ronsan St SW
- 124 Church St SW
- 202 Church St SW
- 124 Ronsan St SW
- 132 Church St SW
- 136 Ronsan St SW
- 164 Ronsan St SW
- 115 Ronsan St SW
- 210 Church St SW
- 708 Beechy Dr SW
- 604 W Main St
- 529 Maple St SW