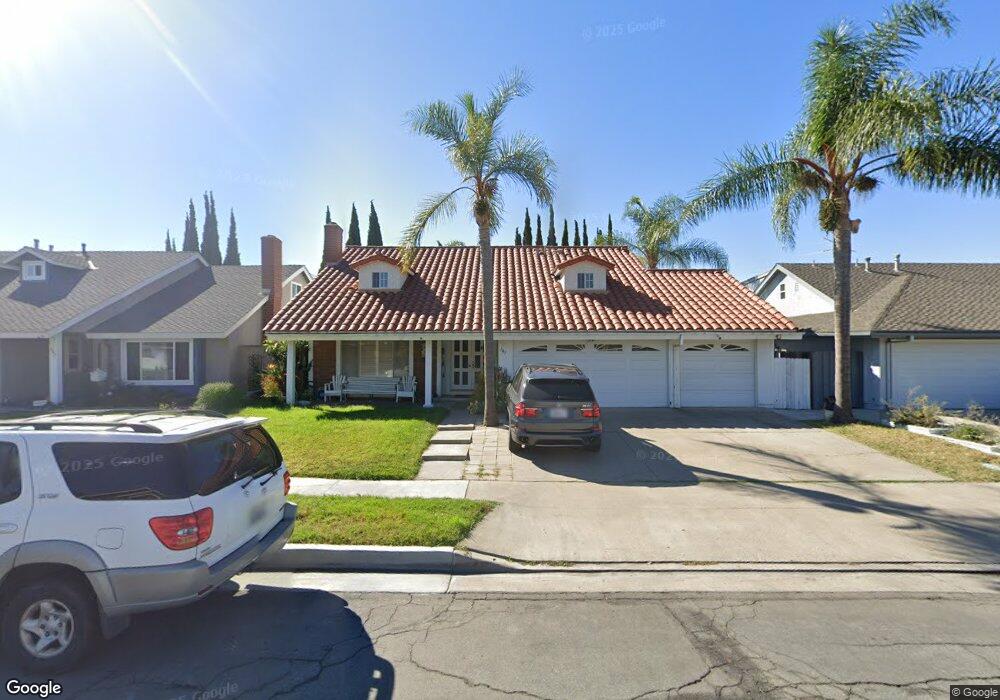
143 S Carousel St Anaheim, CA 92806
North Anaheim NeighborhoodEstimated Value: $1,042,000 - $1,100,000
4
Beds
3
Baths
2,188
Sq Ft
$492/Sq Ft
Est. Value
About This Home
This home is located at 143 S Carousel St, Anaheim, CA 92806 and is currently estimated at $1,076,476, approximately $491 per square foot. 143 S Carousel St is a home located in Orange County with nearby schools including Sunkist Elementary School, Sycamore Junior High School, and Katella High School.
Ownership History
Date
Name
Owned For
Owner Type
Purchase Details
Closed on
Jun 20, 2023
Sold by
Reyes Luis Rolando and Reyes Norma Alicia
Bought by
Reyes Family Trust and Reyes
Current Estimated Value
Purchase Details
Closed on
Nov 9, 2012
Sold by
Reyes Luis and Reyes Norma
Bought by
Reyes Luis R and Reyes Norma A
Home Financials for this Owner
Home Financials are based on the most recent Mortgage that was taken out on this home.
Original Mortgage
$228,000
Interest Rate
3.34%
Mortgage Type
New Conventional
Purchase Details
Closed on
Nov 15, 1999
Sold by
Jeung Lee
Bought by
Reyes Luis and Reyes Norma
Home Financials for this Owner
Home Financials are based on the most recent Mortgage that was taken out on this home.
Original Mortgage
$199,800
Interest Rate
8.12%
Purchase Details
Closed on
Feb 2, 1995
Sold by
Hwang Ui Sang
Bought by
Lee Jeung S
Home Financials for this Owner
Home Financials are based on the most recent Mortgage that was taken out on this home.
Original Mortgage
$146,400
Interest Rate
8.46%
Create a Home Valuation Report for This Property
The Home Valuation Report is an in-depth analysis detailing your home's value as well as a comparison with similar homes in the area
Home Values in the Area
Average Home Value in this Area
Purchase History
| Date | Buyer | Sale Price | Title Company |
|---|---|---|---|
| Reyes Family Trust | -- | None Listed On Document | |
| Reyes Luis R | -- | Title 365 | |
| Reyes Luis | $256,000 | -- | |
| Lee Jeung S | $183,000 | South Coast Title Company |
Source: Public Records
Mortgage History
| Date | Status | Borrower | Loan Amount |
|---|---|---|---|
| Previous Owner | Reyes Luis R | $228,000 | |
| Previous Owner | Reyes Luis | $199,800 | |
| Previous Owner | Lee Jeung S | $146,400 |
Source: Public Records
Tax History Compared to Growth
Tax History
| Year | Tax Paid | Tax Assessment Tax Assessment Total Assessment is a certain percentage of the fair market value that is determined by local assessors to be the total taxable value of land and additions on the property. | Land | Improvement |
|---|---|---|---|---|
| 2025 | $4,553 | $393,455 | $211,390 | $182,065 |
| 2024 | $4,553 | $385,741 | $207,245 | $178,496 |
| 2023 | $4,455 | $378,178 | $203,181 | $174,997 |
| 2022 | $4,397 | $370,763 | $199,197 | $171,566 |
| 2021 | $4,402 | $363,494 | $195,292 | $168,202 |
| 2020 | $4,383 | $359,767 | $193,289 | $166,478 |
| 2019 | $4,252 | $352,713 | $189,499 | $163,214 |
| 2018 | $4,164 | $345,798 | $185,784 | $160,014 |
| 2017 | $4,000 | $339,018 | $182,141 | $156,877 |
| 2016 | $3,987 | $332,371 | $178,570 | $153,801 |
| 2015 | $3,950 | $327,379 | $175,888 | $151,491 |
| 2014 | $3,708 | $320,967 | $172,443 | $148,524 |
Source: Public Records
Map
Nearby Homes
- 165 S Connie Cir
- 115 S Connie Cir
- 120 S Sunkist St
- 2430 E Agave St Unit 4
- 2410 E Agave St Unit 10
- 2410 E Agave St Unit 2
- 2443 E Westport Cir
- 2842 E Virginia Ave
- 2430 E Lincoln Ave Unit 4
- 2420 E Lincoln Ave Unit 2
- 2420 E Lincoln Ave Unit 3
- 2420 E Agave St Unit 5
- 2420 E Agave St Unit 6
- Plan 1394 at Sunflower
- Plan 1810 Modeled at Sunflower
- Plan 1771 at Sunflower
- Plan 1827 at Sunflower
- Plan 1378 Modeled at Sunflower
- 238 S Trevor St
- 636 S Lakeshore Dr
- 139 S Carousel St
- 147 S Carousel St
- 144 S Chantilly St
- 140 S Chantilly St
- 148 S Chantilly St
- 135 S Carousel St
- 151 S Carousel St
- 136 S Chantilly St
- 144 S Carousel St
- 148 S Carousel St
- 140 S Carousel St
- 131 S Carousel St
- 155 S Carousel St
- 152 S Carousel St
- 152 S Chantilly St
- 136 S Carousel St
- 132 S Chantilly St
- 143 S Chantilly St
- 132 S Carousel St
- 156 S Carousel St