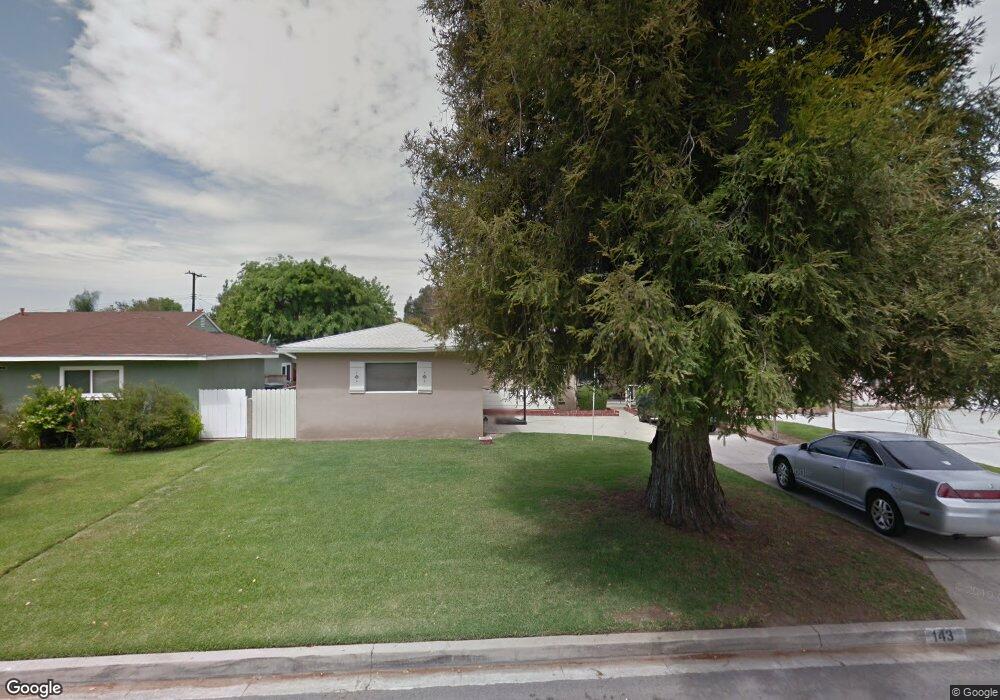
143 S Mockingbird Ln West Covina, CA 91791
Estimated Value: $730,215 - $860,000
3
Beds
2
Baths
1,203
Sq Ft
$678/Sq Ft
Est. Value
About This Home
This home is located at 143 S Mockingbird Ln, West Covina, CA 91791 and is currently estimated at $816,054, approximately $678 per square foot. 143 S Mockingbird Ln is a home located in Los Angeles County with nearby schools including Mesa Elementary School, South Hills High School, and Christ Lutheran School.
Ownership History
Date
Name
Owned For
Owner Type
Purchase Details
Closed on
Jun 22, 2017
Sold by
Manley Tiffani E
Bought by
Manley Timothy Lee
Current Estimated Value
Home Financials for this Owner
Home Financials are based on the most recent Mortgage that was taken out on this home.
Original Mortgage
$356,250
Interest Rate
3.95%
Mortgage Type
New Conventional
Purchase Details
Closed on
Jun 29, 2009
Sold by
Manley Lucille D
Bought by
Manley Timothy Lee
Purchase Details
Closed on
Feb 27, 2002
Sold by
Manley Lucille D
Bought by
Manley Lucille D and The Lucille D Manley Family Tr
Create a Home Valuation Report for This Property
The Home Valuation Report is an in-depth analysis detailing your home's value as well as a comparison with similar homes in the area
Purchase History
| Date | Buyer | Sale Price | Title Company |
|---|---|---|---|
| Manley Timothy Lee | -- | Wfg National Title | |
| Manley Timothy Lee | -- | None Available | |
| Manley Lucille D | -- | None Available | |
| Manley Lucille D | -- | -- |
Source: Public Records
Mortgage History
| Date | Status | Borrower | Loan Amount |
|---|---|---|---|
| Closed | Manley Timothy Lee | $356,250 |
Source: Public Records
Tax History
| Year | Tax Paid | Tax Assessment Tax Assessment Total Assessment is a certain percentage of the fair market value that is determined by local assessors to be the total taxable value of land and additions on the property. | Land | Improvement |
|---|---|---|---|---|
| 2025 | $1,324 | $60,485 | $23,995 | $36,490 |
| 2024 | $1,291 | $59,300 | $23,525 | $35,775 |
| 2023 | $1,274 | $58,138 | $23,064 | $35,074 |
| 2022 | $1,257 | $56,999 | $22,612 | $34,387 |
| 2021 | $1,234 | $55,882 | $22,169 | $33,713 |
| 2019 | $1,202 | $54,226 | $21,512 | $32,714 |
| 2018 | $1,054 | $53,164 | $21,091 | $32,073 |
| 2016 | $970 | $51,102 | $20,273 | $30,829 |
| 2015 | $959 | $50,335 | $19,969 | $30,366 |
| 2014 | $959 | $49,350 | $19,578 | $29,772 |
Source: Public Records
Map
Nearby Homes
- 2516 E Walnut Creek Pkwy
- 3114 E Garvey Ave S
- 2551 E Larkwood St
- 567 S Aldenville Ave
- 566 S Hepner Ave
- 645 S Eastbury Ave
- 130 S Barranca St Unit 302
- 1834 E Holly Oak Dr
- 130 S Barranca Ave Unit 305
- 224 S Azusa Ave
- 512 S Barranca St
- 235 S Azusa Ave
- 530 S Stewart Dr
- 511 W Puente St Unit 1
- 640 S Azusa Ave
- 401 S Myrtlewood St
- 662 E Workman St
- 1626 E Mardina St
- 1717 Cabrillo
- 231 E Dexter St
- 147 S Mockingbird Ln
- 137 S Mockingbird Ln
- 131 S Mockingbird Ln
- 136 S Manzanita Dr
- 126 S Manzanita Dr
- 140 S Manzanita Dr
- 125 S Mockingbird Ln
- 205 S Mockingbird Ln
- 122 S Manzanita Dr
- 144 S Mockingbird Ln
- 148 S Mockingbird Ln
- 138 S Mockingbird Ln
- 144 S Manzanita Dr
- 202 S Mockingbird Ln
- 132 S Mockingbird Ln
- 119 S Mockingbird Ln
- 209 S Mockingbird Ln
- 116 S Manzanita Dr
- 206 S Mockingbird Ln
- 126 S Mockingbird Ln
Your Personal Tour Guide
Ask me questions while you tour the home.