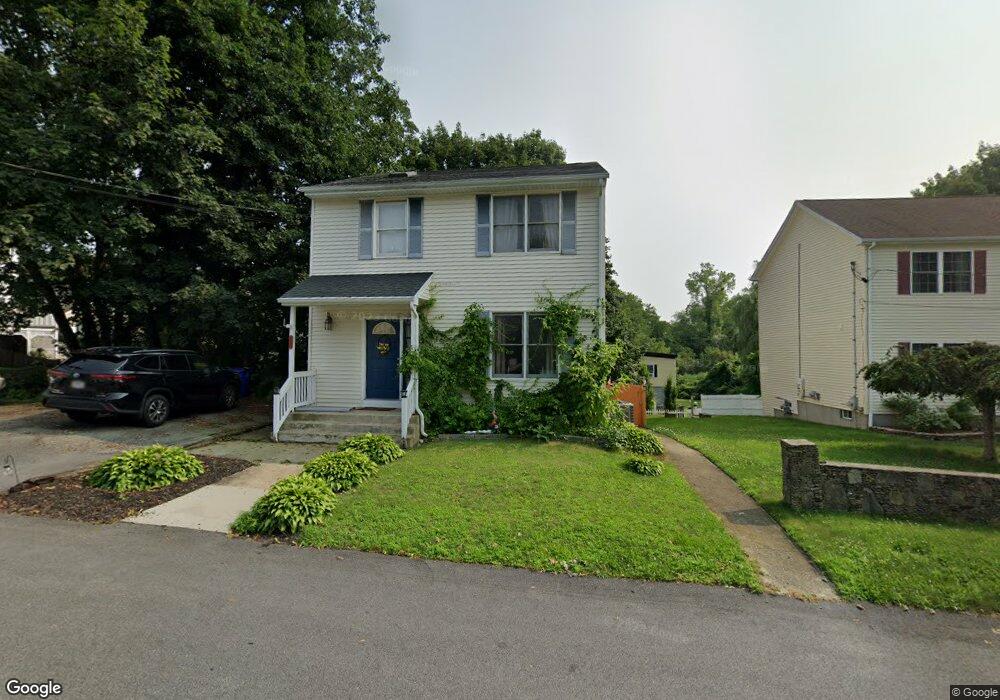
143 Slade St Fall River, MA 02724
Sandy Beach NeighborhoodEstimated Value: $435,749 - $501,000
3
Beds
2
Baths
1,920
Sq Ft
$241/Sq Ft
Est. Value
About This Home
This home is located at 143 Slade St, Fall River, MA 02724 and is currently estimated at $462,187, approximately $240 per square foot. 143 Slade St is a home located in Bristol County with nearby schools including Carlton M. Viveiros Elementary School, Matthew J. Kuss Middle School, and B M C Durfee High School.
Ownership History
Date
Name
Owned For
Owner Type
Purchase Details
Closed on
Jan 12, 2004
Sold by
Harvey Lesley A and Harvey Mark D
Bought by
Mantell Dawn M
Current Estimated Value
Home Financials for this Owner
Home Financials are based on the most recent Mortgage that was taken out on this home.
Original Mortgage
$238,410
Outstanding Balance
$111,340
Interest Rate
5.88%
Mortgage Type
Purchase Money Mortgage
Estimated Equity
$350,847
Create a Home Valuation Report for This Property
The Home Valuation Report is an in-depth analysis detailing your home's value as well as a comparison with similar homes in the area
Home Values in the Area
Average Home Value in this Area
Purchase History
| Date | Buyer | Sale Price | Title Company |
|---|---|---|---|
| Mantell Dawn M | $264,900 | -- |
Source: Public Records
Mortgage History
| Date | Status | Borrower | Loan Amount |
|---|---|---|---|
| Open | Mantell Dawn M | $17,062 | |
| Open | Mantell Dawn M | $238,410 |
Source: Public Records
Tax History
| Year | Tax Paid | Tax Assessment Tax Assessment Total Assessment is a certain percentage of the fair market value that is determined by local assessors to be the total taxable value of land and additions on the property. | Land | Improvement |
|---|---|---|---|---|
| 2025 | $3,714 | $324,400 | $107,500 | $216,900 |
| 2024 | $3,478 | $302,700 | $103,600 | $199,100 |
| 2023 | $3,509 | $286,000 | $85,600 | $200,400 |
| 2022 | $3,125 | $247,600 | $81,500 | $166,100 |
| 2021 | $3,054 | $220,800 | $77,500 | $143,300 |
| 2020 | $3,040 | $210,400 | $76,400 | $134,000 |
| 2019 | $2,948 | $202,200 | $73,600 | $128,600 |
| 2018 | $2,937 | $200,900 | $79,700 | $121,200 |
| 2017 | $2,729 | $194,900 | $75,900 | $119,000 |
| 2016 | $2,625 | $192,600 | $80,800 | $111,800 |
| 2015 | $2,557 | $195,500 | $80,800 | $114,700 |
| 2014 | $2,429 | $193,100 | $78,400 | $114,700 |
Source: Public Records
Map
Nearby Homes
- 245 Dwelly St
- 464 Birch St
- 609 King Philip St
- 20 Wilcox St
- 1852 S Main St
- 1846 S Main St
- 24 Valley St
- 616 Woodman St
- 15 Higgins St
- 57 Larouche St
- 126 Wheeler St
- 2229 S Main St
- 234 Kilburn St
- 1334 S Main St
- 917 Dwelly St
- 1273-1279 S Main St
- 70 Brown St
- 344-354 E Main St
- 579 Summit St Unit 3
- 579 Summit St Unit 2
Your Personal Tour Guide
Ask me questions while you tour the home.