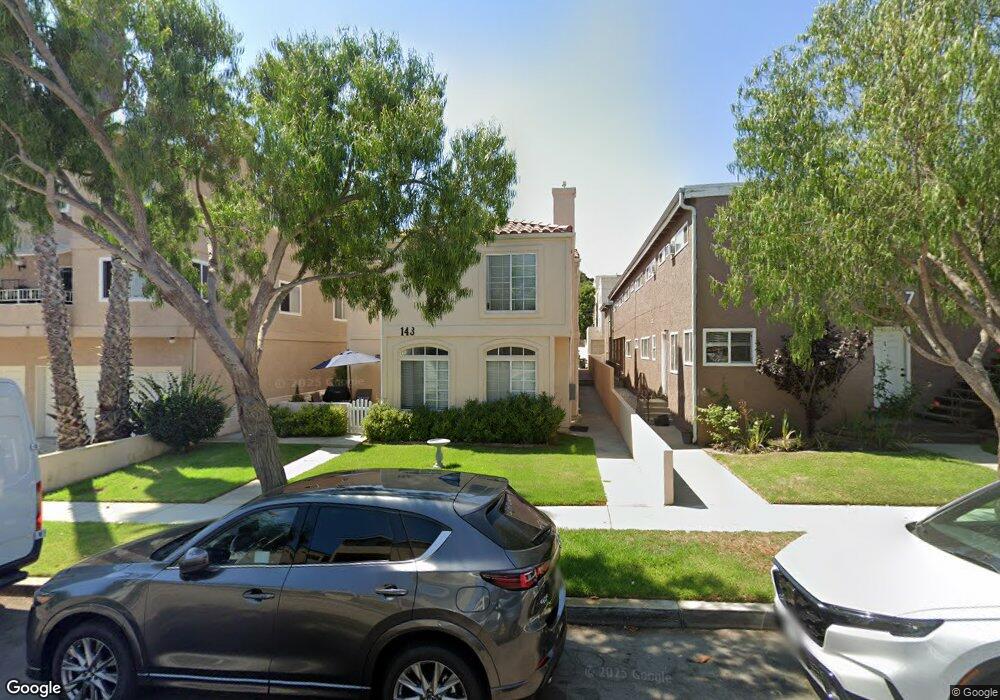
143 Whiting St Unit 3 El Segundo, CA 90245
Estimated Value: $1,273,000 - $1,411,331
3
Beds
3
Baths
1,978
Sq Ft
$686/Sq Ft
Est. Value
About This Home
This home is located at 143 Whiting St Unit 3, El Segundo, CA 90245 and is currently estimated at $1,356,333, approximately $685 per square foot. 143 Whiting St Unit 3 is a home located in Los Angeles County with nearby schools including Richmond Street Elementary School, El Segundo Middle School, and El Segundo High School.
Ownership History
Date
Name
Owned For
Owner Type
Purchase Details
Closed on
Jun 23, 2005
Sold by
Zimmerman Dennis
Bought by
Zimmerman Dennis W and Zimmerman Carmela Cortez
Current Estimated Value
Purchase Details
Closed on
Dec 19, 2001
Sold by
Newman Anne P
Bought by
Zimmerman Dennis
Home Financials for this Owner
Home Financials are based on the most recent Mortgage that was taken out on this home.
Original Mortgage
$251,250
Interest Rate
6.89%
Purchase Details
Closed on
Sep 1, 1993
Sold by
Hartman Kenneth J
Bought by
Newman Harry and Newman Anne P
Home Financials for this Owner
Home Financials are based on the most recent Mortgage that was taken out on this home.
Original Mortgage
$150,000
Interest Rate
7.1%
Create a Home Valuation Report for This Property
The Home Valuation Report is an in-depth analysis detailing your home's value as well as a comparison with similar homes in the area
Home Values in the Area
Average Home Value in this Area
Purchase History
| Date | Buyer | Sale Price | Title Company |
|---|---|---|---|
| Zimmerman Dennis W | -- | None Available | |
| Zimmerman Dennis | $335,000 | Lawyers Title Company | |
| Zimmerman Dennis | -- | Lawyers Title Company | |
| Newman Harry | $221,000 | Chicago Title Company |
Source: Public Records
Mortgage History
| Date | Status | Borrower | Loan Amount |
|---|---|---|---|
| Previous Owner | Zimmerman Dennis | $251,250 | |
| Previous Owner | Newman Harry | $150,000 |
Source: Public Records
Tax History Compared to Growth
Tax History
| Year | Tax Paid | Tax Assessment Tax Assessment Total Assessment is a certain percentage of the fair market value that is determined by local assessors to be the total taxable value of land and additions on the property. | Land | Improvement |
|---|---|---|---|---|
| 2025 | $5,511 | $494,869 | $237,832 | $257,037 |
| 2024 | $5,511 | $485,167 | $233,169 | $251,998 |
| 2023 | $5,369 | $475,655 | $228,598 | $247,057 |
| 2022 | $5,425 | $466,329 | $224,116 | $242,213 |
| 2021 | $5,340 | $457,186 | $219,722 | $237,464 |
| 2019 | $5,157 | $443,628 | $213,206 | $230,422 |
| 2018 | $4,832 | $434,930 | $209,026 | $225,904 |
| 2016 | $4,676 | $418,043 | $200,910 | $217,133 |
| 2015 | $4,617 | $411,765 | $197,893 | $213,872 |
| 2014 | $4,522 | $403,700 | $194,017 | $209,683 |
Source: Public Records
Map
Nearby Homes
- 360 Hillcrest St
- 724 Loma Vista St
- 226 Arena St Unit A
- 505 W Maple Ave
- 745 Main St Unit 107
- 836 Loma Vista St
- 516 Penn St
- 125 W Sycamore Ave
- 329 E Maple Ave
- 900 Cedar St Unit 308
- 931 Hillcrest St
- 955 Virginia St
- 935 Main St Unit 303
- 608 Lomita St
- 950 Main St Unit 205
- 212 E Imperial Ave Unit A
- 212 E Imperial Ave Unit E
- 217 43rd St
- 4216 Highland Ave Unit B
- 848 Penn St
- 143 Whiting St
- 143 Whiting St Unit 2
- 143 Whiting St Unit 1
- 147 Whiting St
- 135 Whiting St
- 133 Whiting St
- 203 Whiting St Unit D
- 203 Whiting St Unit C
- 203 Whiting St Unit B
- 140 Loma Vista St
- 515 W Franklin Ave Unit B
- 515 W Franklin Ave
- 140 Whiting St
- 202 Whiting St
- 517 W Franklin Ave
- 211 Whiting St
- 206 Whiting St
- 527 W Franklin Ave
- 122 Loma Vista St
- 208 Loma Vista St