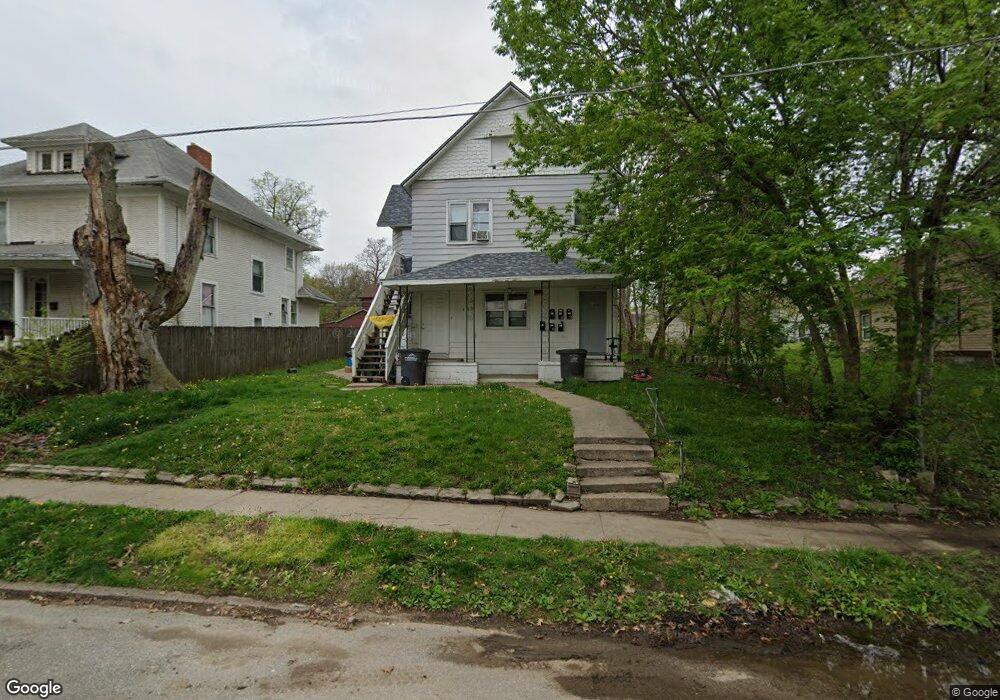
1430 8th St Unit 4 Des Moines, IA 50314
River Bend NeighborhoodEstimated Value: $107,302 - $120,000
--
Bed
1
Bath
371
Sq Ft
$306/Sq Ft
Est. Value
About This Home
This home is located at 1430 8th St Unit 4, Des Moines, IA 50314 and is currently estimated at $113,651, approximately $306 per square foot. 1430 8th St Unit 4 is a home located in Polk County with nearby schools including Moulton Elementary School, Harding Middle School, and North High School.
Ownership History
Date
Name
Owned For
Owner Type
Purchase Details
Closed on
Mar 11, 2025
Sold by
Viking Enterprises Llc
Bought by
Casa 29 Management Llc
Current Estimated Value
Purchase Details
Closed on
Nov 20, 2020
Sold by
Sowada John M
Bought by
Viking Enterpises Llc
Home Financials for this Owner
Home Financials are based on the most recent Mortgage that was taken out on this home.
Original Mortgage
$61,875
Interest Rate
2.9%
Mortgage Type
Future Advance Clause Open End Mortgage
Purchase Details
Closed on
Nov 2, 2020
Sold by
Hughes Nenita
Bought by
Sowada John
Home Financials for this Owner
Home Financials are based on the most recent Mortgage that was taken out on this home.
Original Mortgage
$61,875
Interest Rate
2.9%
Mortgage Type
Future Advance Clause Open End Mortgage
Purchase Details
Closed on
Feb 7, 2015
Sold by
Hearn Daniel C
Bought by
Hughes Nenita
Purchase Details
Closed on
Aug 20, 1998
Sold by
Melak Lc
Bought by
Hearn Daniel C
Purchase Details
Closed on
May 13, 1998
Sold by
Melak L C
Bought by
Hughes Hollie E and Hughes Nita L
Create a Home Valuation Report for This Property
The Home Valuation Report is an in-depth analysis detailing your home's value as well as a comparison with similar homes in the area
Home Values in the Area
Average Home Value in this Area
Purchase History
| Date | Buyer | Sale Price | Title Company |
|---|---|---|---|
| Casa 29 Management Llc | $125,000 | None Listed On Document | |
| Viking Enterpises Llc | -- | None Available | |
| Sowada John | $82,500 | None Available | |
| Hughes Nenita | $32,000 | None Available | |
| Hearn Daniel C | -- | -- | |
| Hughes Hollie E | $45,000 | -- |
Source: Public Records
Mortgage History
| Date | Status | Borrower | Loan Amount |
|---|---|---|---|
| Previous Owner | Sowada John | $61,875 |
Source: Public Records
Tax History Compared to Growth
Tax History
| Year | Tax Paid | Tax Assessment Tax Assessment Total Assessment is a certain percentage of the fair market value that is determined by local assessors to be the total taxable value of land and additions on the property. | Land | Improvement |
|---|---|---|---|---|
| 2025 | $2,932 | $161,000 | $8,800 | $152,200 |
| 2024 | $2,932 | $149,000 | $7,700 | $141,300 |
| 2023 | $3,158 | $149,000 | $7,700 | $141,300 |
| 2022 | $3,692 | $134,000 | $6,400 | $127,600 |
| 2021 | $3,284 | $134,000 | $6,400 | $127,600 |
| 2020 | $3,690 | $110,000 | $5,900 | $104,100 |
| 2019 | $3,222 | $110,000 | $5,900 | $104,100 |
| 2018 | $3,428 | $91,000 | $5,900 | $85,100 |
| 2017 | $3,214 | $91,000 | $5,900 | $85,100 |
| 2016 | $3,350 | $82,000 | $4,900 | $77,100 |
| 2015 | $3,350 | $82,000 | $4,900 | $77,100 |
| 2014 | $3,132 | $73,000 | $4,900 | $68,100 |
Source: Public Records
Map
Nearby Homes