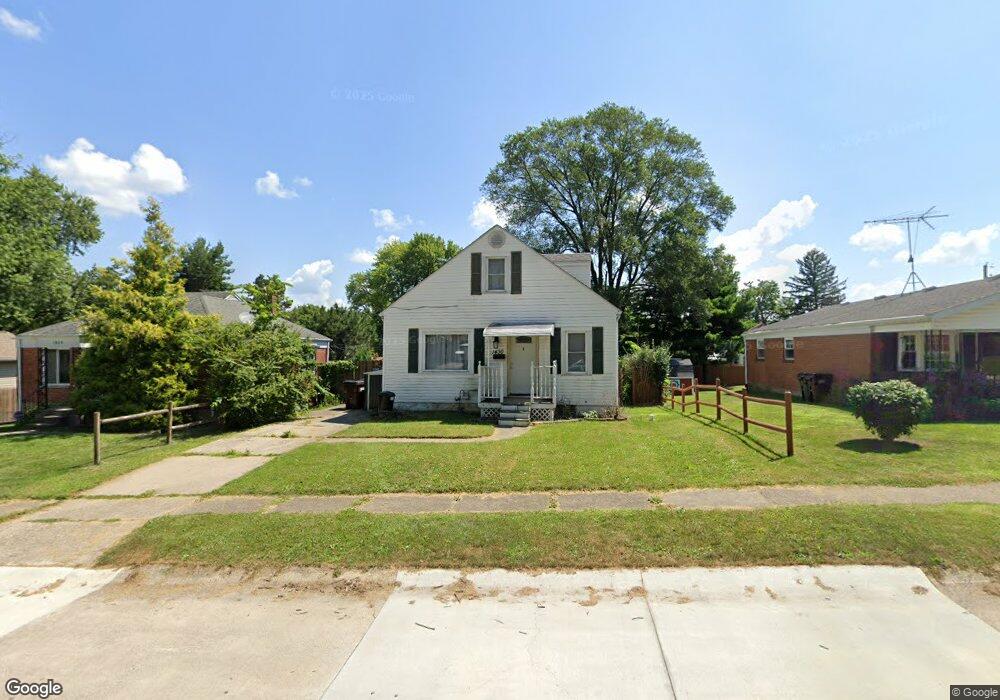
1430 Flesher Ave Dayton, OH 45420
Estimated Value: $158,000 - $182,000
3
Beds
1
Bath
1,120
Sq Ft
$148/Sq Ft
Est. Value
About This Home
This home is located at 1430 Flesher Ave, Dayton, OH 45420 and is currently estimated at $165,511, approximately $147 per square foot. 1430 Flesher Ave is a home located in Montgomery County with nearby schools including Greenmont Elementary School, Kettering Middle School, and Kettering Fairmont High School.
Ownership History
Date
Name
Owned For
Owner Type
Purchase Details
Closed on
Apr 18, 2019
Sold by
Marker Jennifer L and Marker Alan W
Bought by
Moneypenny Nathan A
Current Estimated Value
Purchase Details
Closed on
Aug 1, 2012
Sold by
Marker Alan W and Stanley Jennifer L
Bought by
Marker Alan W and Marker Jennifer L
Home Financials for this Owner
Home Financials are based on the most recent Mortgage that was taken out on this home.
Original Mortgage
$97,461
Interest Rate
3.65%
Mortgage Type
FHA
Purchase Details
Closed on
Jul 21, 2006
Sold by
Rogers Michael A and Rogers Deanna L
Bought by
Marker Alan W and Stanley Jennifer L
Home Financials for this Owner
Home Financials are based on the most recent Mortgage that was taken out on this home.
Original Mortgage
$93,950
Interest Rate
9.75%
Mortgage Type
Balloon
Purchase Details
Closed on
Nov 22, 1996
Sold by
Mccord Gary E and Mccord Joanna W
Bought by
Rogers Michael A and Rogers Deanna L
Create a Home Valuation Report for This Property
The Home Valuation Report is an in-depth analysis detailing your home's value as well as a comparison with similar homes in the area
Home Values in the Area
Average Home Value in this Area
Purchase History
| Date | Buyer | Sale Price | Title Company |
|---|---|---|---|
| Moneypenny Nathan A | $82,800 | Title Source Inc | |
| Marker Alan W | -- | Performance Title Llc | |
| Marker Alan W | $94,000 | Nordic Title Agency Ltd | |
| Rogers Michael A | $62,500 | -- |
Source: Public Records
Mortgage History
| Date | Status | Borrower | Loan Amount |
|---|---|---|---|
| Previous Owner | Marker Alan W | $97,461 | |
| Previous Owner | Marker Alan W | $93,950 |
Source: Public Records
Tax History Compared to Growth
Tax History
| Year | Tax Paid | Tax Assessment Tax Assessment Total Assessment is a certain percentage of the fair market value that is determined by local assessors to be the total taxable value of land and additions on the property. | Land | Improvement |
|---|---|---|---|---|
| 2024 | $2,438 | $38,180 | $10,050 | $28,130 |
| 2023 | $2,438 | $38,180 | $10,050 | $28,130 |
| 2022 | $2,042 | $25,230 | $6,660 | $18,570 |
| 2021 | $1,893 | $25,230 | $6,660 | $18,570 |
| 2020 | $1,899 | $25,230 | $6,660 | $18,570 |
| 2019 | $1,766 | $20,720 | $6,660 | $14,060 |
| 2018 | $1,775 | $20,720 | $6,660 | $14,060 |
| 2017 | $1,640 | $20,720 | $6,660 | $14,060 |
| 2016 | $1,685 | $20,510 | $6,660 | $13,850 |
| 2015 | $1,611 | $20,510 | $6,660 | $13,850 |
| 2014 | $1,611 | $20,510 | $6,660 | $13,850 |
| 2012 | -- | $24,900 | $6,720 | $18,180 |
Source: Public Records
Map
Nearby Homes
- 1508 Horlacher Ave
- 1512 Horlacher Ave
- 4802 Amesborough Rd
- 1513 Horlacher Ave
- 1744 Woodman Dr
- 4643 Amesborough Rd
- 4549 Amesborough Rd
- 2830 Kennedy Ave
- 4527 Amesborough Rd
- 4869 Andes Dr
- 1910 Roop Place
- 4515 Kingview Ave
- 1914 W Bataan Dr
- 2277 Lido Place
- 1108 Chelsea Ave
- 1300 Watervliet Ave
- 4733 Barnhart Ave
- 1630 Falke Dr
- 1840 Culver Ave
- 1025 Weng Ave
- 1424 Flesher Ave
- 1434 Flesher Ave
- 1440 Flesher Ave
- 1420 Flesher Ave
- 1435 Bauer Ave
- 1425 Bauer Ave
- 1414 Flesher Ave
- 1421 Bauer Ave
- 1441 Bauer Ave
- 1431 Flesher Ave
- 1425 Flesher Ave
- 1435 Flesher Ave
- 1500 Flesher Ave
- 1421 Flesher Ave
- 1441 Flesher Ave
- 1413 Flesher Ave
- 2604 Flesher Ave
- 4910 Eastgate Ave
- 1501 Bauer Ave
- 1504 Flesher Ave