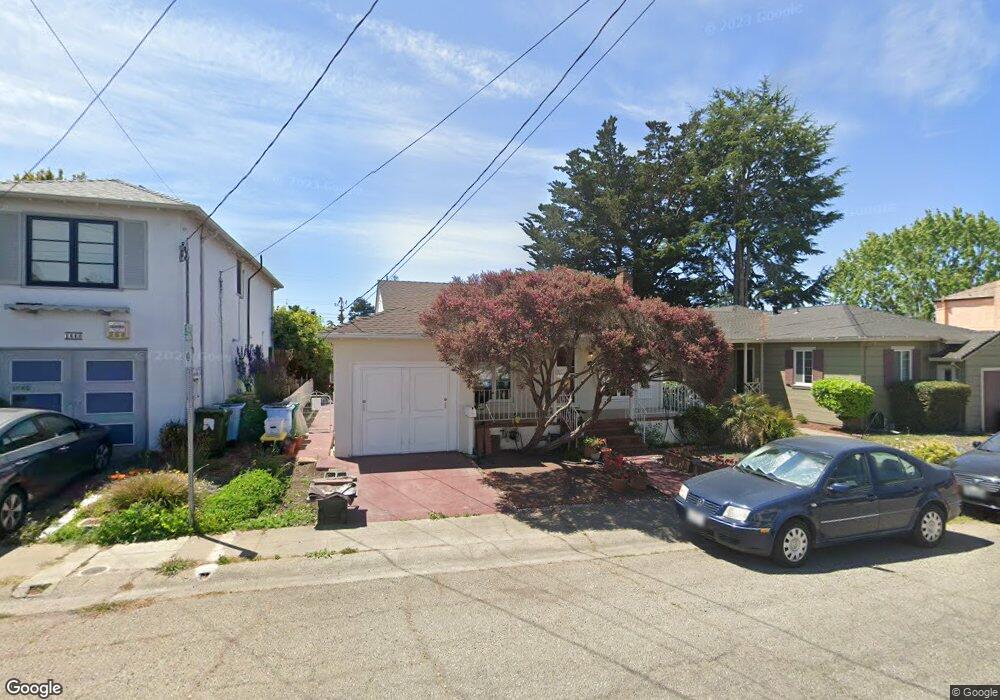
1430 Keoncrest Dr Berkeley, CA 94702
West Berkeley NeighborhoodEstimated Value: $1,119,000 - $1,509,000
2
Beds
1
Bath
1,018
Sq Ft
$1,277/Sq Ft
Est. Value
About This Home
This home is located at 1430 Keoncrest Dr, Berkeley, CA 94702 and is currently estimated at $1,300,102, approximately $1,277 per square foot. 1430 Keoncrest Dr is a home located in Alameda County with nearby schools including Ruth Acty Elementary, Berkeley Arts Magnet at Whittier School, and Thousand Oaks Elementary School.
Ownership History
Date
Name
Owned For
Owner Type
Purchase Details
Closed on
Nov 9, 2000
Sold by
Kroncke Martha J
Bought by
Hutheesing Vivek and Kalgutkar Anjali
Current Estimated Value
Home Financials for this Owner
Home Financials are based on the most recent Mortgage that was taken out on this home.
Original Mortgage
$306,200
Outstanding Balance
$110,734
Interest Rate
7.62%
Estimated Equity
$1,189,368
Purchase Details
Closed on
Oct 9, 1997
Sold by
Meraw Mary Kathleen
Bought by
Kroncke Martha Jane
Purchase Details
Closed on
Dec 26, 1995
Sold by
Lustig Anna and Anna Lustig Family Trust
Bought by
Kroncke Martha Jane and Meraw Mary Kathleen
Home Financials for this Owner
Home Financials are based on the most recent Mortgage that was taken out on this home.
Original Mortgage
$179,200
Interest Rate
7.36%
Create a Home Valuation Report for This Property
The Home Valuation Report is an in-depth analysis detailing your home's value as well as a comparison with similar homes in the area
Home Values in the Area
Average Home Value in this Area
Purchase History
| Date | Buyer | Sale Price | Title Company |
|---|---|---|---|
| Hutheesing Vivek | $383,000 | Placer Title Company | |
| Kroncke Martha Jane | $2,000 | -- | |
| Kroncke Martha Jane | $224,000 | Chicago Title Co |
Source: Public Records
Mortgage History
| Date | Status | Borrower | Loan Amount |
|---|---|---|---|
| Open | Hutheesing Vivek | $306,200 | |
| Previous Owner | Kroncke Martha Jane | $179,200 |
Source: Public Records
Tax History
| Year | Tax Paid | Tax Assessment Tax Assessment Total Assessment is a certain percentage of the fair market value that is determined by local assessors to be the total taxable value of land and additions on the property. | Land | Improvement |
|---|---|---|---|---|
| 2025 | $9,708 | $569,625 | $173,123 | $403,502 |
| 2024 | $9,708 | $558,320 | $169,729 | $395,591 |
| 2023 | $9,444 | $554,236 | $166,401 | $387,835 |
| 2022 | $9,207 | $536,372 | $163,139 | $380,233 |
| 2021 | $9,220 | $525,717 | $159,940 | $372,777 |
| 2020 | $8,748 | $527,257 | $158,301 | $368,956 |
| 2019 | $8,417 | $516,919 | $155,197 | $361,722 |
| 2018 | $8,260 | $506,786 | $152,155 | $354,631 |
| 2017 | $7,957 | $496,851 | $149,172 | $347,679 |
| 2016 | $7,692 | $487,111 | $146,248 | $340,863 |
| 2015 | $7,589 | $479,798 | $144,052 | $335,746 |
| 2014 | $7,515 | $470,402 | $141,231 | $329,171 |
Source: Public Records
Map
Nearby Homes
- 1564 Sacramento St
- 1436 Delaware St
- 1322 Virginia St
- 1529 Ada St
- 1813 Sacramento St
- 1411 Hearst Ave Unit 2
- 1516 Belvedere Ave
- 1207 Francisco St
- 1207 Francisco St Unit 2
- 1808 Cedar St
- 1728 Curtis St
- 1261 Hearst Ave
- 1400 Santa fe Ave
- 1815 Vine St
- 1919 Curtis St
- 1509 Francis St
- 1128 Delaware St
- 1625 Martin Luther King jr Way
- 2118 California St
- 1120 Curtis St
- 1440 Keoncrest Dr
- 1420 Keoncrest Dr
- 1450 Keoncrest Dr
- 1429 Cedar St
- 1410 Keoncrest Dr
- 1439 Cedar St
- 1419 Cedar St
- 1545 Acton St
- 1449 Cedar St
- 1415 Keoncrest Dr
- 1460 Keoncrest Dr
- 1549 Acton St
- 1539 Acton St
- 1415 Cedar St
- 1459 Cedar St
- 1431 Catherine Dr
- 1529 Acton St
- 1470 Keoncrest Dr
- 1461 Keoncrest Dr
- 1555 Acton St
Your Personal Tour Guide
Ask me questions while you tour the home.