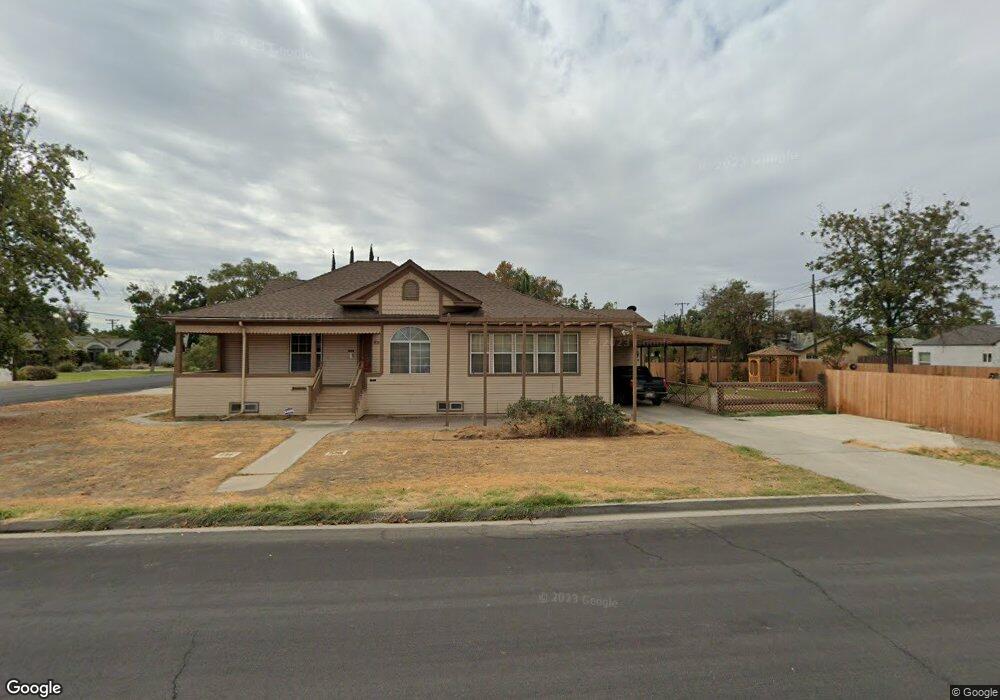
1430 Whitmore St Hanford, CA 93230
Estimated Value: $354,000 - $422,000
3
Beds
2
Baths
1,860
Sq Ft
$214/Sq Ft
Est. Value
About This Home
This home is located at 1430 Whitmore St, Hanford, CA 93230 and is currently estimated at $398,053, approximately $214 per square foot. 1430 Whitmore St is a home located in Kings County with nearby schools including Monroe Elementary School, Woodrow Wilson Junior High School, and Hanford High School.
Ownership History
Date
Name
Owned For
Owner Type
Purchase Details
Closed on
Feb 10, 2016
Sold by
Rooney Janet M
Bought by
Rooney Janet M and Janet Rooney Living Trust
Current Estimated Value
Purchase Details
Closed on
Oct 10, 2005
Sold by
Thompson Stephen and Thompson Bernadette
Bought by
Rooney Janet M
Home Financials for this Owner
Home Financials are based on the most recent Mortgage that was taken out on this home.
Original Mortgage
$228,000
Outstanding Balance
$121,343
Interest Rate
5.67%
Mortgage Type
Fannie Mae Freddie Mac
Estimated Equity
$276,710
Purchase Details
Closed on
Aug 11, 2004
Sold by
Olmstead Jerry L and Olmstead Eileen M
Bought by
Thompson Stephen and Thompson Bernadette
Home Financials for this Owner
Home Financials are based on the most recent Mortgage that was taken out on this home.
Original Mortgage
$196,000
Interest Rate
7.2%
Mortgage Type
Purchase Money Mortgage
Purchase Details
Closed on
Dec 7, 2002
Sold by
Olmstead Jerry L
Bought by
Olmstead Jerry L and Olmstead Eileen M
Home Financials for this Owner
Home Financials are based on the most recent Mortgage that was taken out on this home.
Original Mortgage
$122,150
Interest Rate
6.06%
Purchase Details
Closed on
Jul 14, 2000
Sold by
Olmstead Eileen M
Bought by
Olmstead Jerry L
Home Financials for this Owner
Home Financials are based on the most recent Mortgage that was taken out on this home.
Original Mortgage
$114,000
Interest Rate
8.37%
Purchase Details
Closed on
Jun 22, 2000
Sold by
Kavanaugh Sheila L
Bought by
Olmstead Jerry L
Home Financials for this Owner
Home Financials are based on the most recent Mortgage that was taken out on this home.
Original Mortgage
$114,000
Interest Rate
8.37%
Purchase Details
Closed on
Apr 15, 1999
Sold by
Kavanaugh Sheila L and Audino Nicholas K
Bought by
Kavanaugh Sheila Louise and Audino Erika A
Purchase Details
Closed on
Jun 3, 1997
Sold by
Kavanaugh John D
Bought by
Kavanaugh Sheila Louise
Purchase Details
Closed on
Apr 30, 1997
Sold by
Kavanaugh John D
Bought by
Kavanaugh John D and Kavanaugh Sheila Louise
Home Financials for this Owner
Home Financials are based on the most recent Mortgage that was taken out on this home.
Original Mortgage
$80,000
Interest Rate
7.86%
Purchase Details
Closed on
Apr 2, 1997
Sold by
Kavanaugh Sheila Isaac and Kavanaugh Charles
Bought by
Kavanaugh John D
Home Financials for this Owner
Home Financials are based on the most recent Mortgage that was taken out on this home.
Original Mortgage
$80,000
Interest Rate
7.86%
Create a Home Valuation Report for This Property
The Home Valuation Report is an in-depth analysis detailing your home's value as well as a comparison with similar homes in the area
Home Values in the Area
Average Home Value in this Area
Purchase History
| Date | Buyer | Sale Price | Title Company |
|---|---|---|---|
| Rooney Janet M | -- | None Available | |
| Rooney Janet M | $285,000 | Chicago Title Company | |
| Thompson Stephen | $245,000 | Stewart Title Co | |
| Olmstead Jerry L | -- | Chicago Title Company | |
| Olmstead Jerry L | -- | Chicago Title Co | |
| Olmstead Jerry L | $120,000 | Chicago Title Co | |
| Kavanaugh Shiela Louise | -- | -- | |
| Kavanaugh Sheila Louise | -- | -- | |
| Kavanaugh Sheila Louise | -- | -- | |
| Kavanaugh John D | -- | -- | |
| Kavanaugh John D | -- | Chicago Title Insurance Co |
Source: Public Records
Mortgage History
| Date | Status | Borrower | Loan Amount |
|---|---|---|---|
| Open | Rooney Janet M | $228,000 | |
| Previous Owner | Thompson Stephen | $196,000 | |
| Previous Owner | Olmstead Jerry L | $122,150 | |
| Previous Owner | Olmstead Jerry L | $114,000 | |
| Previous Owner | Kavanaugh John D | $80,000 | |
| Closed | Thompson Stephen | $49,000 |
Source: Public Records
Tax History Compared to Growth
Tax History
| Year | Tax Paid | Tax Assessment Tax Assessment Total Assessment is a certain percentage of the fair market value that is determined by local assessors to be the total taxable value of land and additions on the property. | Land | Improvement |
|---|---|---|---|---|
| 2025 | $4,058 | $389,474 | $88,826 | $300,648 |
| 2023 | $4,058 | $374,352 | $85,378 | $288,974 |
| 2022 | $3,970 | $367,012 | $83,704 | $283,308 |
| 2021 | $3,060 | $285,000 | $65,000 | $220,000 |
| 2020 | $2,787 | $255,000 | $60,000 | $195,000 |
| 2019 | $2,271 | $208,500 | $55,000 | $153,500 |
| 2018 | $2,201 | $201,000 | $55,000 | $146,000 |
| 2017 | $4,585 | $198,975 | $55,000 | $143,975 |
| 2016 | $2,168 | $198,975 | $50,000 | $148,975 |
| 2015 | $2,079 | $189,500 | $40,000 | $149,500 |
| 2014 | $1,780 | $163,238 | $40,182 | $123,056 |
Source: Public Records
Map
Nearby Homes
- 1401 N Richmond Ave
- 1328 N Redington St
- 414 W Cameron St
- 1320 N Irwin St
- 219 Katherine St
- 2035 W Chianti Way
- 1900 Easy St
- 964 Greenfield Ave
- 423 W Florinda St
- 75 W Grangeville Blvd
- 1923 Emma Lee Ln
- 14 W Grangeville Blvd
- 1301 N Douty St
- 98 E Grangeville Blvd
- 23 E Grangeville Blvd
- 117 E Grangeville Blvd
- 1209 W Water St
- 1967 Mulberry Dr
- 240 W Terrace Dr
- 109 Lorita Way
- 1428 Whitmore St
- 625 Neville St
- 610 Neville St
- 1443 N 11th Ave
- 600 Neville St
- 629 Neville St
- 1404 Whitmore St
- 517 Neville St
- 616 Neville St
- 631 Neville St
- 1501 Whitmore St
- 626 Neville St
- 515 Neville St
- 1402 Whitmore St
- 628 Neville St
- 1514 Whitmore St
- 635 Neville St
- 1445 N 11th Ave
- 1405 Whitmore St
- 1435 N 11th Ave