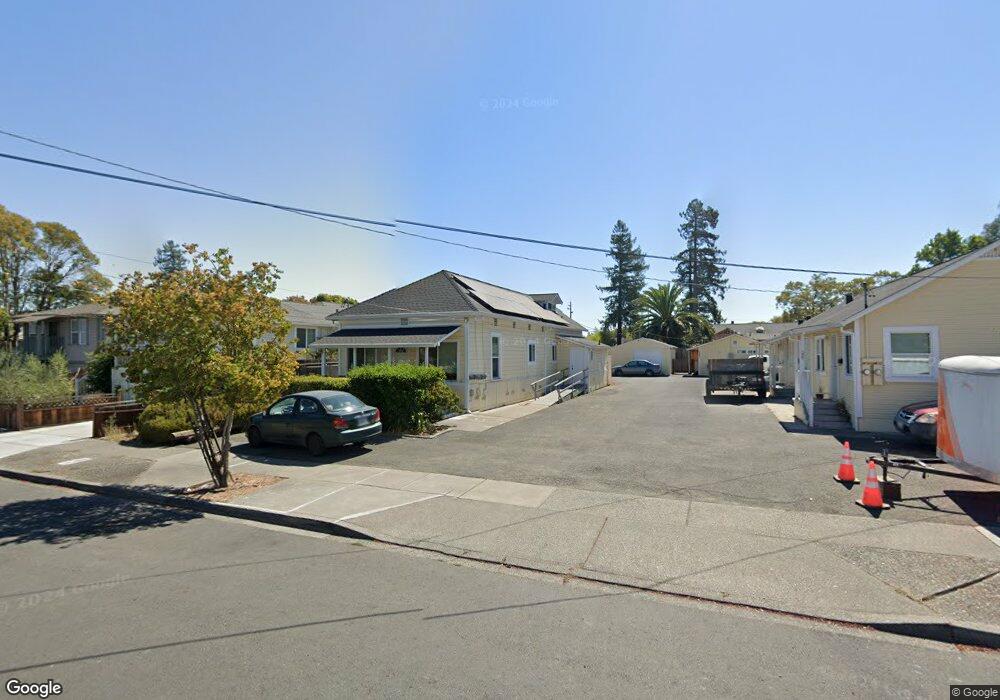
1431 Menlo Ave Napa, CA 94558
McPherson NeighborhoodEstimated Value: $730,000 - $882,000
--
Bed
--
Bath
--
Sq Ft
7,841
Sq Ft Lot
About This Home
This home is located at 1431 Menlo Ave, Napa, CA 94558 and is currently estimated at $805,998. 1431 Menlo Ave is a home located in Napa County with nearby schools including West Park Elementary School, Redwood Middle School, and Napa High School.
Ownership History
Date
Name
Owned For
Owner Type
Purchase Details
Closed on
Aug 20, 2024
Sold by
Thomas And Mary Riley Revocable Trust and Riley Thomas M
Bought by
Riley Mary Lee and Riley Thomas Michael
Current Estimated Value
Home Financials for this Owner
Home Financials are based on the most recent Mortgage that was taken out on this home.
Original Mortgage
$350,000
Outstanding Balance
$346,055
Interest Rate
6.89%
Mortgage Type
New Conventional
Estimated Equity
$459,943
Purchase Details
Closed on
Dec 4, 2015
Sold by
Riley Thomas M and Riley Mary L
Bought by
The Thomas & Mary Riley Revocable Trust
Purchase Details
Closed on
Jun 25, 1999
Sold by
Scott Donald C and Scott Eva J
Bought by
Riley Thomas M and Riley Mary L
Home Financials for this Owner
Home Financials are based on the most recent Mortgage that was taken out on this home.
Original Mortgage
$136,000
Interest Rate
7.2%
Create a Home Valuation Report for This Property
The Home Valuation Report is an in-depth analysis detailing your home's value as well as a comparison with similar homes in the area
Home Values in the Area
Average Home Value in this Area
Purchase History
| Date | Buyer | Sale Price | Title Company |
|---|---|---|---|
| Riley Mary Lee | -- | Chicago Title | |
| The Thomas & Mary Riley Revocable Trust | -- | None Available | |
| Riley Thomas M | $170,000 | Napa Land Title Company |
Source: Public Records
Mortgage History
| Date | Status | Borrower | Loan Amount |
|---|---|---|---|
| Open | Riley Mary Lee | $350,000 | |
| Previous Owner | Riley Thomas M | $136,000 | |
| Closed | Riley Thomas M | $17,000 |
Source: Public Records
Tax History Compared to Growth
Tax History
| Year | Tax Paid | Tax Assessment Tax Assessment Total Assessment is a certain percentage of the fair market value that is determined by local assessors to be the total taxable value of land and additions on the property. | Land | Improvement |
|---|---|---|---|---|
| 2025 | $4,190 | $266,488 | $141,083 | $125,405 |
| 2024 | $4,190 | $261,264 | $138,317 | $122,947 |
| 2023 | $4,190 | $256,142 | $135,605 | $120,537 |
| 2022 | $4,212 | $251,121 | $132,947 | $118,174 |
| 2021 | $4,227 | $246,198 | $130,341 | $115,857 |
| 2020 | $4,263 | $243,675 | $129,005 | $114,670 |
| 2019 | $4,154 | $238,898 | $126,476 | $112,422 |
| 2018 | $4,060 | $234,215 | $123,997 | $110,218 |
| 2017 | $3,940 | $229,623 | $121,566 | $108,057 |
| 2016 | $3,752 | $225,122 | $119,183 | $105,939 |
| 2015 | $3,455 | $221,741 | $117,393 | $104,348 |
| 2014 | $3,395 | $217,398 | $115,094 | $102,304 |
Source: Public Records
Map
Nearby Homes
- 1421 Menlo Ave
- 1441 Menlo Ave
- 1411 Menlo Ave
- 1451 Menlo Ave
- 1461 Menlo Ave
- 1401 Menlo Ave
- 2745 Santa Clara St
- 1422 Park Ave
- 1420 Park Ave
- 1440 Park Ave
- 1450 Park Ave
- 2750 El Dorado
- 2730 El Dorado
- 1408 Park Ave
- 1458 Park Ave
- 1400 Park Ave
- 2702 El Dorado
- 1371 Menlo Ave
- 2730 Santa Clara St
- 2720 Santa Clara St