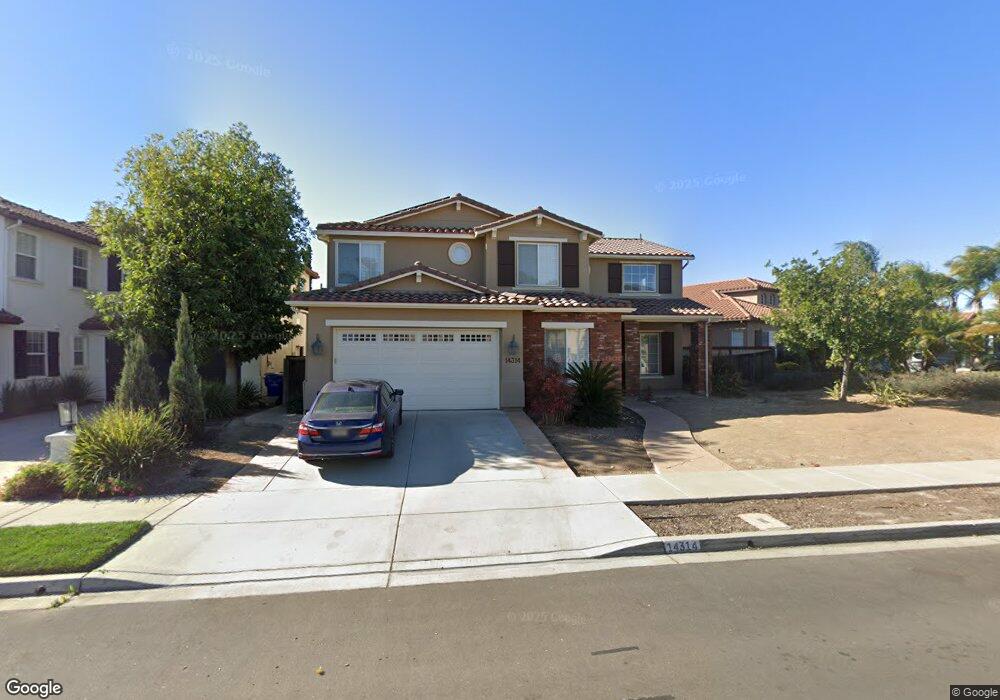
14314 Claymore Ct San Diego, CA 92129
Rancho Peñasquitos NeighborhoodEstimated Value: $1,827,419 - $2,359,000
4
Beds
3
Baths
3,422
Sq Ft
$605/Sq Ft
Est. Value
About This Home
This home is located at 14314 Claymore Ct, San Diego, CA 92129 and is currently estimated at $2,070,355, approximately $605 per square foot. 14314 Claymore Ct is a home located in San Diego County with nearby schools including Adobe Bluffs Elementary School, Black Mountain Middle School, and Mt. Carmel High School.
Ownership History
Date
Name
Owned For
Owner Type
Purchase Details
Closed on
Oct 9, 2020
Sold by
Uyeda Kendrick A and Uyeda Mabel C
Bought by
Uyeda Kendrick A and Uyeda Mabel C
Current Estimated Value
Purchase Details
Closed on
Aug 20, 2012
Sold by
Uyeda Mabel C
Bought by
Uyeda Kendrick A
Home Financials for this Owner
Home Financials are based on the most recent Mortgage that was taken out on this home.
Original Mortgage
$510,000
Outstanding Balance
$350,468
Interest Rate
3.5%
Mortgage Type
New Conventional
Estimated Equity
$1,719,887
Purchase Details
Closed on
Aug 9, 2012
Sold by
Cline Steve T and Cline Nancy L
Bought by
Uyeda Kendrick A
Home Financials for this Owner
Home Financials are based on the most recent Mortgage that was taken out on this home.
Original Mortgage
$510,000
Outstanding Balance
$350,468
Interest Rate
3.5%
Mortgage Type
New Conventional
Estimated Equity
$1,719,887
Purchase Details
Closed on
Jun 13, 2001
Sold by
Greystone Homes Inc
Bought by
Cline Steve T and Cline Nancy L
Home Financials for this Owner
Home Financials are based on the most recent Mortgage that was taken out on this home.
Original Mortgage
$506,000
Interest Rate
7.05%
Create a Home Valuation Report for This Property
The Home Valuation Report is an in-depth analysis detailing your home's value as well as a comparison with similar homes in the area
Home Values in the Area
Average Home Value in this Area
Purchase History
| Date | Buyer | Sale Price | Title Company |
|---|---|---|---|
| Uyeda Kendrick A | -- | None Available | |
| Uyeda Kendrick A | -- | None Available | |
| Uyeda Kendrick A | -- | Equity Title San Diego | |
| Uyeda Kendrick A | $710,000 | Equity Title | |
| Cline Steve T | $633,000 | North American Title Co |
Source: Public Records
Mortgage History
| Date | Status | Borrower | Loan Amount |
|---|---|---|---|
| Open | Uyeda Kendrick A | $510,000 | |
| Previous Owner | Cline Steve T | $506,000 |
Source: Public Records
Tax History Compared to Growth
Tax History
| Year | Tax Paid | Tax Assessment Tax Assessment Total Assessment is a certain percentage of the fair market value that is determined by local assessors to be the total taxable value of land and additions on the property. | Land | Improvement |
|---|---|---|---|---|
| 2025 | $11,653 | $874,302 | $276,455 | $597,847 |
| 2024 | $11,653 | $857,160 | $271,035 | $586,125 |
| 2023 | $11,397 | $840,354 | $265,721 | $574,633 |
| 2022 | $11,182 | $823,877 | $260,511 | $563,366 |
| 2021 | $10,965 | $807,723 | $255,403 | $552,320 |
| 2020 | $10,840 | $799,442 | $252,785 | $546,657 |
| 2019 | $10,631 | $783,768 | $247,829 | $535,939 |
| 2018 | $10,416 | $768,401 | $242,970 | $525,431 |
| 2017 | $10,207 | $753,335 | $238,206 | $515,129 |
| 2016 | $9,982 | $738,565 | $233,536 | $505,029 |
| 2015 | $9,821 | $727,472 | $230,029 | $497,443 |
| 2014 | $9,595 | $713,223 | $225,524 | $487,699 |
Source: Public Records
Map
Nearby Homes
- 14305 El Vestido St
- 8862 La Cartera St
- 9120 Meadowrun Place
- 8183 Doug Hill
- 9151 Emden Rd
- 13559 Chaco Ct
- 14442 Calle Nublado
- 13907 Bruyere Ct
- 8730 Twin Trails Dr
- 8114 Sendero de La Pradera
- 9360 Stargaze Ave
- 7808 Santaluz Inlet
- 8415 Run of the Knolls
- 7855 Via Belfiore Unit 1
- 7975 Villas
- 14522 Las Haciendas
- 7930 Entrada Lazanja
- 13338 Via Magdalena Unit 1
- 14523 Caminito Lazanja
- 13800 Torrey Del Mar Dr
- 14322 Claymore Ct
- 14306 Claymore Ct
- 8566 Donaker St
- 14330 Claymore Ct
- 14313 Claymore Ct
- 14321 Claymore Ct
- 14305 Claymore Ct
- 14329 Claymore Ct
- 8560 Donaker St
- 8573 Donaker St
- 8579 Donaker St
- 8567 Donaker St
- 8585 Donaker St
- 8537 Donaker St
- 14337 Claymore Ct
- 8591 Donaker St
- 14312 La Harina Ct
- 8554 Donaker St
- 14320 La Harina Ct
- 14304 La Harina Ct