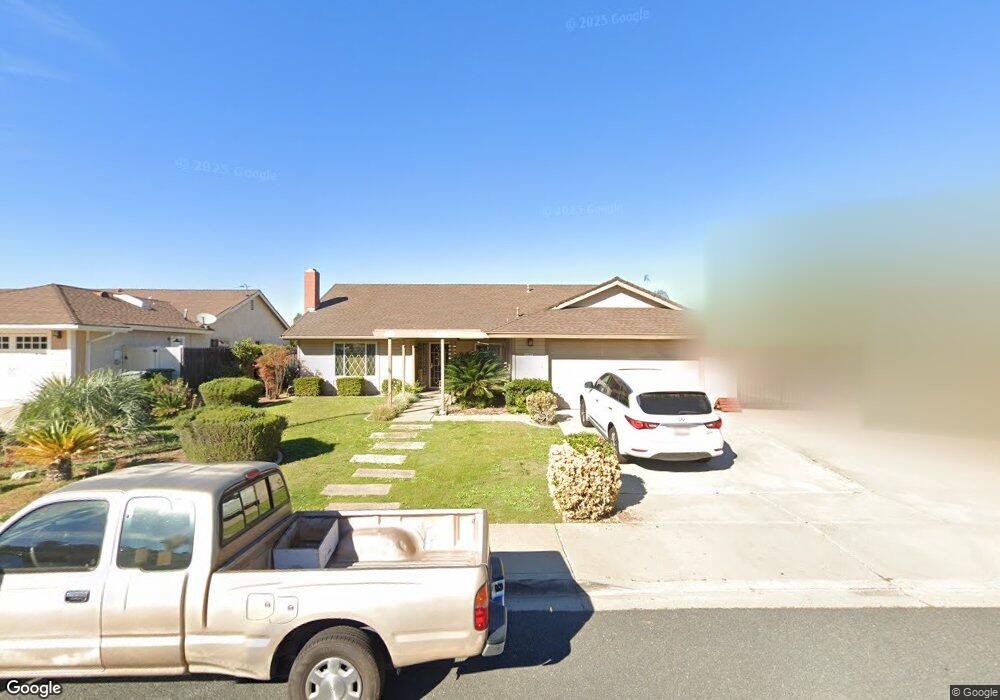
1432 Egret Way El Cajon, CA 92019
Estimated Value: $960,778 - $1,076,000
4
Beds
2
Baths
2,000
Sq Ft
$505/Sq Ft
Est. Value
About This Home
This home is located at 1432 Egret Way, El Cajon, CA 92019 and is currently estimated at $1,010,945, approximately $505 per square foot. 1432 Egret Way is a home located in San Diego County with nearby schools including Meridian Elementary School, Montgomery Middle School, and Valhalla High.
Ownership History
Date
Name
Owned For
Owner Type
Purchase Details
Closed on
Aug 21, 2015
Sold by
Stanley Gordon A
Bought by
Jabro Eman and Jabro Janan
Current Estimated Value
Home Financials for this Owner
Home Financials are based on the most recent Mortgage that was taken out on this home.
Original Mortgage
$378,000
Outstanding Balance
$295,566
Interest Rate
3.86%
Mortgage Type
New Conventional
Estimated Equity
$715,379
Purchase Details
Closed on
Oct 17, 2006
Sold by
Stanley Gordon A
Bought by
Stanley Gordon A
Home Financials for this Owner
Home Financials are based on the most recent Mortgage that was taken out on this home.
Original Mortgage
$493,379
Interest Rate
6.46%
Mortgage Type
Seller Take Back
Purchase Details
Closed on
Jun 11, 2001
Sold by
Stanley Gordon A and Stanley Janet C
Bought by
Stanley Gordon A and Stanley Janet C
Create a Home Valuation Report for This Property
The Home Valuation Report is an in-depth analysis detailing your home's value as well as a comparison with similar homes in the area
Home Values in the Area
Average Home Value in this Area
Purchase History
| Date | Buyer | Sale Price | Title Company |
|---|---|---|---|
| Jabro Eman | $540,000 | Corinthian Title | |
| Stanley Gordon A | -- | None Available | |
| Stanley Gordon A | -- | None Available | |
| Stanley Gordon A | -- | -- |
Source: Public Records
Mortgage History
| Date | Status | Borrower | Loan Amount |
|---|---|---|---|
| Open | Jabro Eman | $378,000 | |
| Previous Owner | Stanley Gordon A | $493,379 |
Source: Public Records
Tax History Compared to Growth
Tax History
| Year | Tax Paid | Tax Assessment Tax Assessment Total Assessment is a certain percentage of the fair market value that is determined by local assessors to be the total taxable value of land and additions on the property. | Land | Improvement |
|---|---|---|---|---|
| 2025 | $8,754 | $639,241 | $211,050 | $428,191 |
| 2024 | $8,754 | $626,708 | $206,912 | $419,796 |
| 2023 | $8,168 | $614,420 | $202,855 | $411,565 |
| 2022 | $7,818 | $602,374 | $198,878 | $403,496 |
| 2021 | $8,020 | $590,564 | $194,979 | $395,585 |
| 2020 | $7,760 | $584,509 | $192,980 | $391,529 |
| 2019 | $6,918 | $573,049 | $189,197 | $383,852 |
| 2018 | $6,804 | $561,814 | $185,488 | $376,326 |
| 2017 | $31 | $550,799 | $181,851 | $368,948 |
| 2016 | $6,447 | $540,000 | $178,286 | $361,714 |
| 2015 | $2,417 | $195,827 | $64,654 | $131,173 |
| 2014 | $2,371 | $191,992 | $63,388 | $128,604 |
Source: Public Records
Map
Nearby Homes
- 1490 Gustavo St Unit E
- 965 Jamacha Rd
- 1524 Gustavo St Unit D
- 995 Amistad Place Unit B
- 987 Amistad Place Unit D
- 913 Amistad Ct Unit D
- 1508 Granite Hills Dr Unit E
- 1518 Granite Hills Dr Unit A
- 1510 Granite Hills Dr Unit E
- 1526 Granite Hills Dr Unit C
- 1380 E Washington Ave Unit 17
- 1380 E Washington Ave Unit 5W
- 1285 E Washington Ave Unit 29
- 1285 E Washington Ave Unit 20
- 828 Waterloo Ave
- 514 Jamacha Rd Unit 6J
- 514 Jamacha Rd Unit 4
- 905 Vista Del Monte Way
- 1904 Grove Rd
- 716 S 2nd St Unit 197
- 1428 Egret Way
- 1444 Egret Way
- 1433 Cary Ct
- 1429 Cary Ct
- 948 Rancho Terrace Ct
- 1445 Cary Ct
- 1456 Egret Way
- 1431 Egret Way
- 1443 Egret Way
- 1427 Egret Way
- 1457 Cary Ct
- 1412 Egret Way
- 934 Rancho Terrace Ct
- 0 Cary Ct
- 1455 Egret Way
- 922 Rancho Terrace Ct
- 1415 Egret Way
- 902 Rancho Terrace Ct
- 1438 Gustavo St
- 1426 Gustavo St