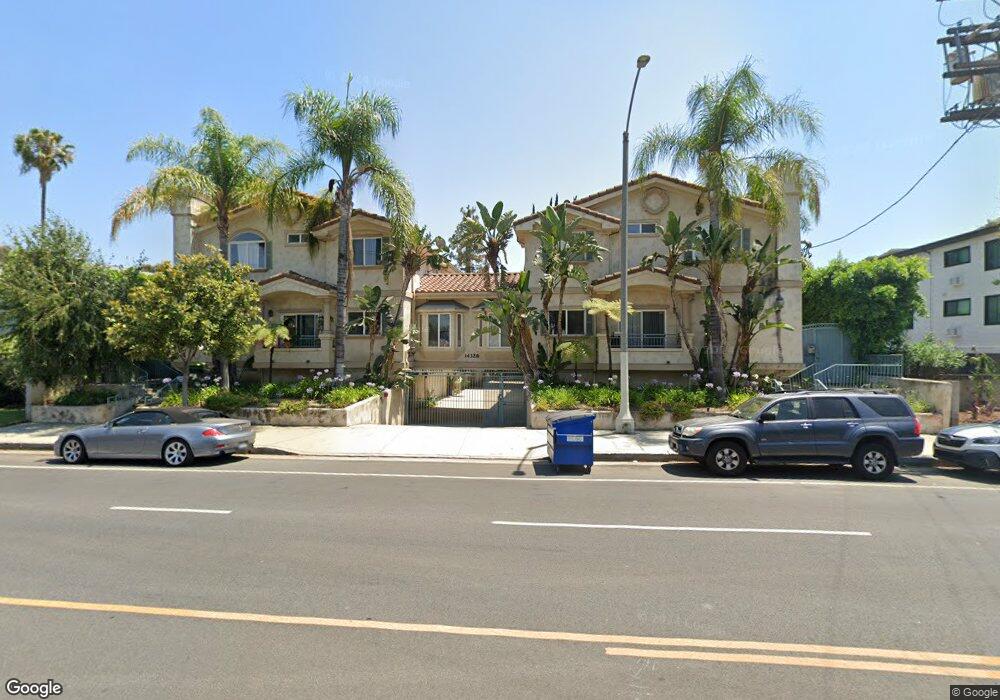
14328 Magnolia Blvd Unit 7 Sherman Oaks, CA 91423
Estimated Value: $743,000 - $886,684
3
Beds
3
Baths
1,776
Sq Ft
$466/Sq Ft
Est. Value
About This Home
This home is located at 14328 Magnolia Blvd Unit 7, Sherman Oaks, CA 91423 and is currently estimated at $827,421, approximately $465 per square foot. 14328 Magnolia Blvd Unit 7 is a home located in Los Angeles County with nearby schools including Chandler Elementary, Van Nuys High School, and Ivy Bound Academy of Math Sci and Tech Charter Middle.
Ownership History
Date
Name
Owned For
Owner Type
Purchase Details
Closed on
Feb 29, 2024
Sold by
Loverde Jay J
Bought by
John Loverde And Dena Loverde Revocable 2024 and Loverde
Current Estimated Value
Purchase Details
Closed on
May 17, 2004
Sold by
Trapman John W
Bought by
Loverde Jay J
Home Financials for this Owner
Home Financials are based on the most recent Mortgage that was taken out on this home.
Original Mortgage
$329,900
Interest Rate
5.37%
Mortgage Type
Purchase Money Mortgage
Purchase Details
Closed on
Sep 21, 2000
Sold by
E D A Development Inc
Bought by
Trapman John W
Home Financials for this Owner
Home Financials are based on the most recent Mortgage that was taken out on this home.
Original Mortgage
$252,000
Interest Rate
7.96%
Create a Home Valuation Report for This Property
The Home Valuation Report is an in-depth analysis detailing your home's value as well as a comparison with similar homes in the area
Home Values in the Area
Average Home Value in this Area
Purchase History
| Date | Buyer | Sale Price | Title Company |
|---|---|---|---|
| John Loverde And Dena Loverde Revocable 2024 | -- | None Listed On Document | |
| Loverde Jay J | $550,000 | Ticor Title Company | |
| Trapman John W | $314,090 | Lawyers Title Company |
Source: Public Records
Mortgage History
| Date | Status | Borrower | Loan Amount |
|---|---|---|---|
| Previous Owner | Loverde Jay J | $329,900 | |
| Previous Owner | Trapman John W | $252,000 | |
| Closed | Trapman John W | $47,200 | |
| Closed | Loverde Jay J | $100,000 |
Source: Public Records
Tax History Compared to Growth
Tax History
| Year | Tax Paid | Tax Assessment Tax Assessment Total Assessment is a certain percentage of the fair market value that is determined by local assessors to be the total taxable value of land and additions on the property. | Land | Improvement |
|---|---|---|---|---|
| 2025 | $9,438 | $781,823 | $487,949 | $293,874 |
| 2024 | $9,438 | $766,494 | $478,382 | $288,112 |
| 2023 | $9,255 | $751,465 | $469,002 | $282,463 |
| 2022 | $8,823 | $736,731 | $459,806 | $276,925 |
| 2021 | $8,711 | $722,287 | $450,791 | $271,496 |
| 2019 | $8,449 | $700,866 | $437,421 | $263,445 |
| 2018 | $8,410 | $687,125 | $428,845 | $258,280 |
| 2016 | $8,033 | $660,445 | $412,194 | $248,251 |
| 2015 | $7,916 | $650,526 | $406,003 | $244,523 |
| 2014 | $7,943 | $637,784 | $398,050 | $239,734 |
Source: Public Records
Map
Nearby Homes
- 14410 Magnolia Blvd
- 5235 Sylmar Ave
- 5310 Circle Dr Unit 108
- 5003 Tilden Ave Unit 109
- 14126 Hartsook St
- 14414 Addison St Unit 18
- 14414 Addison St Unit 17
- 14414 Addison St Unit 24
- 14542 Otsego St
- 14537 Hesby St
- 5242 Vesper Ave Unit 7
- 5102 Vesper Ave
- 4915 Tyrone Ave Unit 102
- 4915 Tyrone Ave Unit 234
- 5420 Sylmar Ave Unit 117
- 14050 Magnolia Blvd Unit 316
- 14608 Mccormick St
- 14347 Albers St Unit 206
- 14560 Clark St Unit 215
- 14560 Clark St Unit 213
- 14328 Magnolia Blvd Unit 1
- 14328 Magnolia Blvd Unit 3
- 14328 Magnolia Blvd Unit 8
- 14328 Magnolia Blvd Unit 6
- 14328 Magnolia Blvd Unit 5
- 14328 Magnolia Blvd Unit 4
- 14328 Magnolia Blvd Unit 2
- 14315 Hartsook St
- 14319 Hartsook St
- 14321 Hartsook St
- 14317 Hartsook St
- 14313 Hartsook St
- 14311 Hartsook St
- 5204 Lennox Ave
- 14309 Hartsook St
- 14321 Magnolia Blvd
- 14307 Hartsook St Unit 12
- 5155 Tyrone Ave
- 14315 Magnolia Blvd Unit C
- 14315 Magnolia Blvd Unit B